
PI-82IntermediatePremium
Raspberry Pi Pico W Function Plotter: y = ax² + bx + c (OLED + 3 Pots)
A math board that plots a quadratic function live with a Raspberry Pi Pico W: three potentiometers pick the coefficients a, b and c from -3 to +3, and a 0.96 inch OLED draws the parabola together with its axes. The side panel shows the discriminant, the roots (two roots, one root or NO REAL ROOT) and the vertex; with a = 0 the graph turns into a line. It answers "what happens if c grows?" in seconds.
0.0(0)
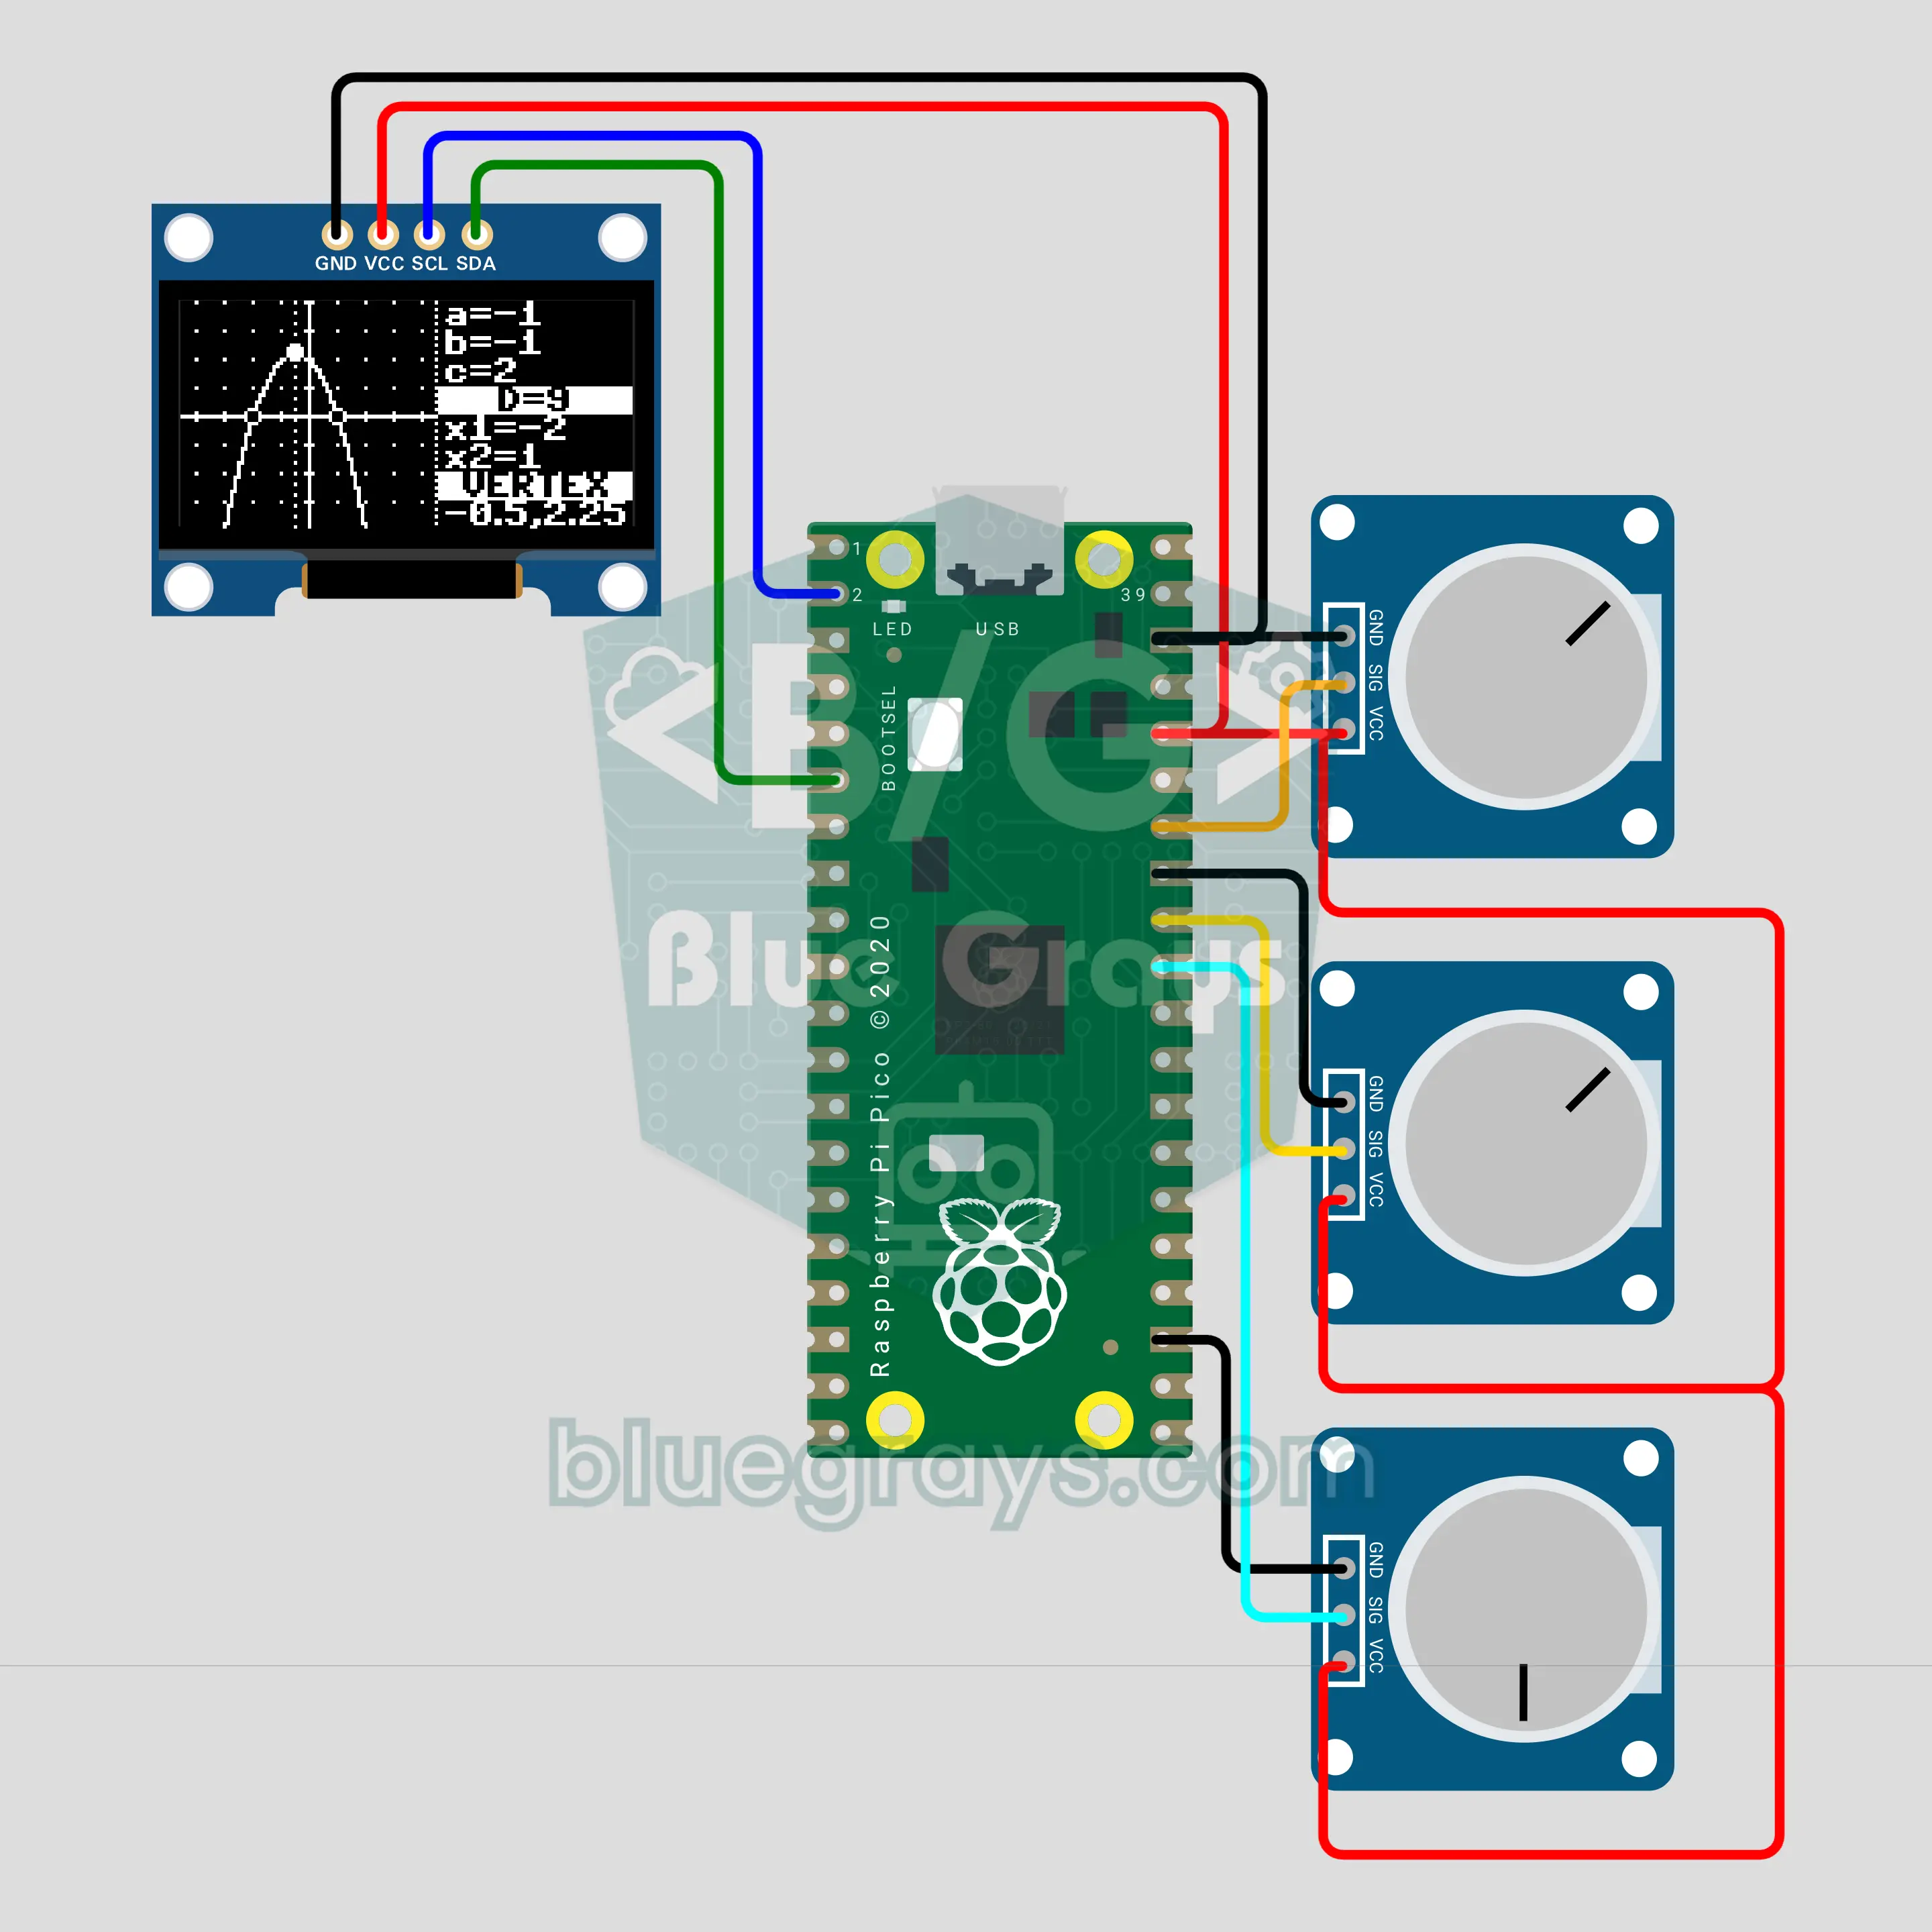
Instead of drawing parabolas on the board one by one, turn a knob and watch the curve change right in front of you. A small screen shows the axes, the parabola, its roots and the vertex; three knobs pick a, b and c, and a side panel lists the discriminant and the roots. You find out for yourself why two roots merge and vanish, and why a negative a turns the parabola upside down.
Source Code
Premium Content
The source code, block version and FAQ of this project are open to Premium members.
- All Project Code
- Block version
- Frequently Asked Questions