
Arduino Heart Rate Sensor: Pulse Sensor and KY-039 BPM Guide
Arduino heart rate sensor guide: Pulse Sensor and KY-039 wiring, BPM with PulseSensorPlayground, pulse wave in the Serial Plotter, OLED, ESP32 and Pico code.
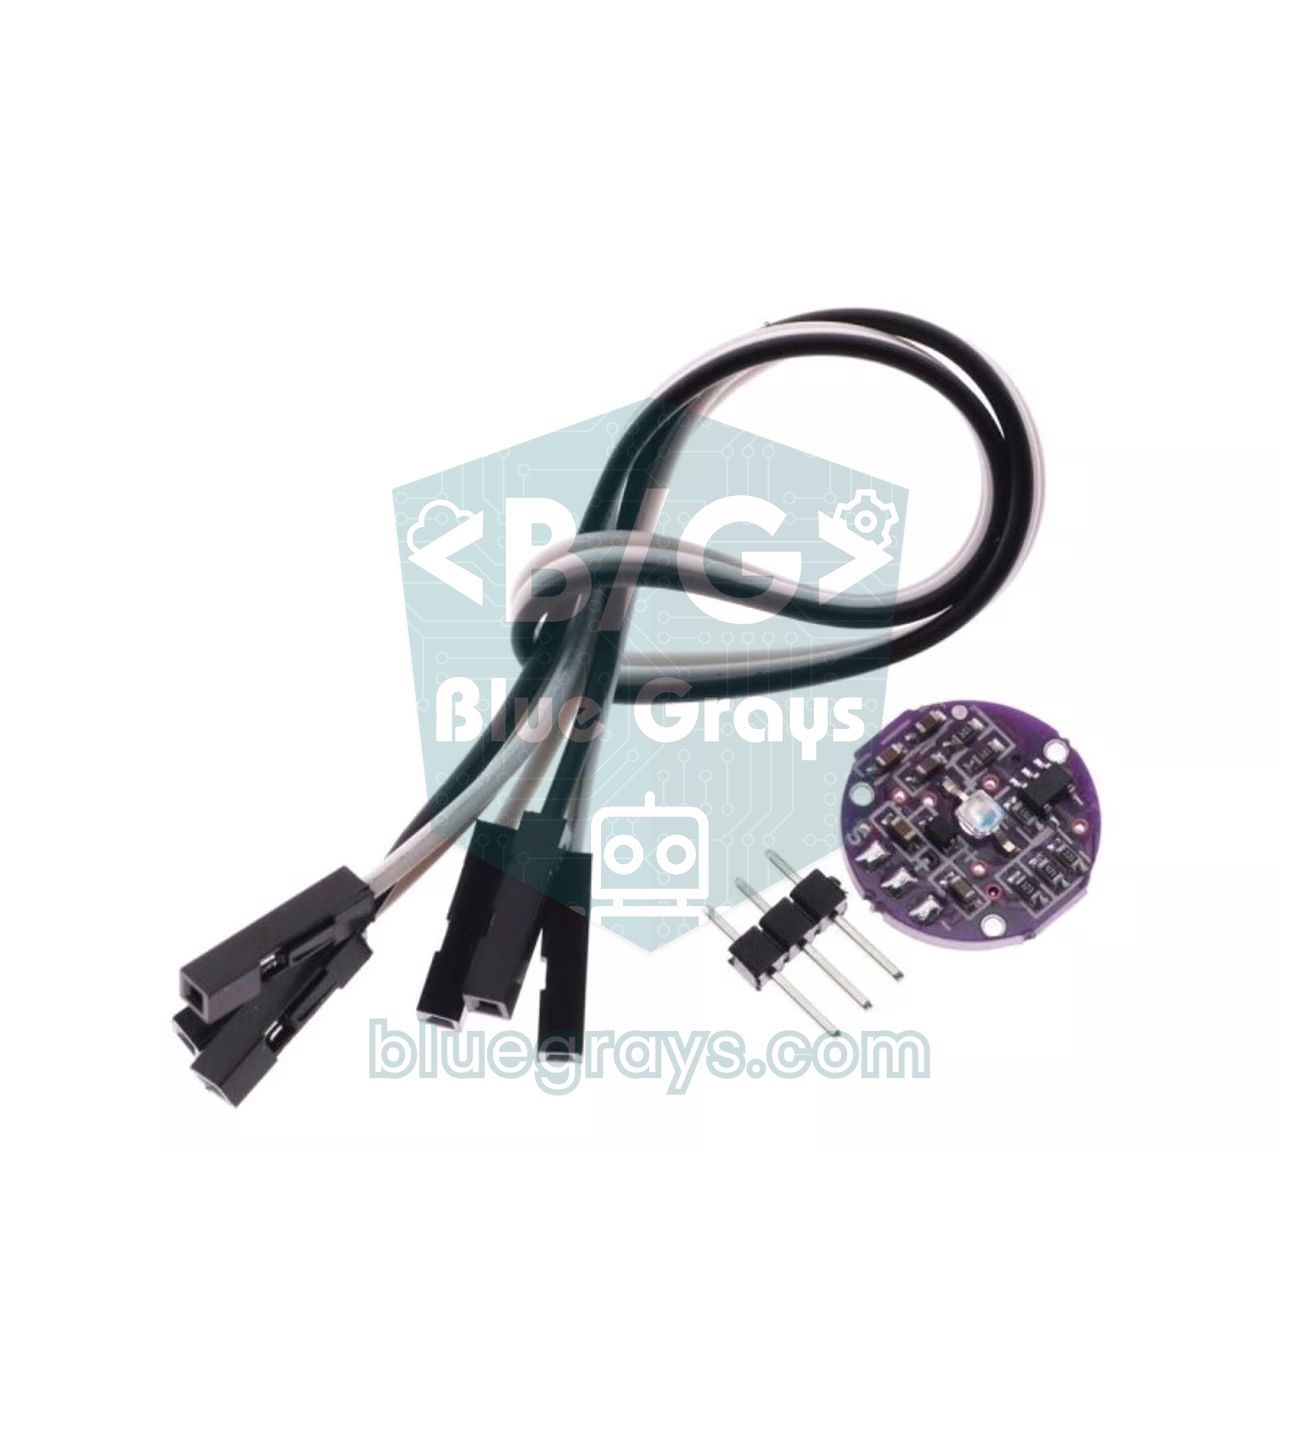
An Arduino pulse sensor, also called a heart rate sensor, is a small module that follows the blood flow in your fingertip or earlobe with light and measures how many times your heart beats per minute, the BPM (beats per minute). The two most common models in hobby electronics are the round Pulse Sensor and the KY-039 with an infrared LED. Both connect with three wires and are read from a single analog pin, but they differ a lot in signal quality and in how hard it is to write reliable code for them.
In this guide you'll learn step by step which physical principle a pulse sensor uses, how to see a real pulse wave in the Serial Plotter, how to calculate BPM with the PulseSensorPlayground library, how to process the KY-039's weak signal with a library-free algorithm and how to show the result on an OLED display with a heart icon. ESP32 and Raspberry Pi Pico code, the factors that spoil a measurement and the difference from the MAX30102 are covered too. One important note up front: these sensors are not medical devices and must not be used for any health-related decision.
How does a pulse sensor work? Photoplethysmography (PPG)
All pulse sensors work with a method called photoplethysmography (PPG). Every time your heart contracts, it sends a wave of blood into the arteries; when this wave reaches the small vessels in your fingertip, the blood volume in the tissue rises briefly. Because the hemoglobin in blood absorbs light, the more blood there is, the less light is reflected back from the tissue or passes through it. The sensor lights up the tissue with an LED and a light sensor measures the light that comes back; this small, regular ripple in the amount of light is the pulse itself.
The hard part is that almost all of the measured light is constant. Skin, muscle, bone and the blood in the veins absorb the same amount of light all the time; this is called the DC component of the signal. The AC component that changes with each heartbeat is usually only about 1–2% of the total light. So the sensor's real job is to separate and amplify a small wave riding on a large, steady level. A PPG wave shows a fast rise to a peak (the systolic peak) followed by a slow fall; the small notch in the middle of the fall and the little bump right after it (the dicrotic notch) come from the aortic valve closing. A good algorithm counts each heartbeat once and doesn't mistake this notch for a second beat.
How the light is sent into the tissue matters too. The Pulse Sensor uses the reflective method: the LED and the light sensor sit on the same face and measure the light scattered back by the skin. Its green light is strongly absorbed by hemoglobin and gives a clear signal from the vessels just under the skin; that's also why you see green LEDs on the back of smartwatches. The KY-039 uses the transmissive method: an infrared LED lights one side of the finger and a phototransistor on the other side measures the light that passes through. Infrared light goes deeper into the tissue, but because the KY-039 has no circuit to amplify the signal, the resulting wave is very small.
| Feature | Pulse Sensor value |
|---|---|
| Measuring method | Reflective PPG |
| Light source | Green LED |
| Light sensor | APDS-9008, peak sensitivity at 565 nm |
| Supply | 3–5 V |
| Current | About 4 mA (at 5 V) |
| Output | Analog; half the supply voltage at idle (~2.5 V at 5 V, ~512 on the Uno) |
| Board diameter | About 16 mm (0.625 in) |
| Wires | On the original: red +, black GND, purple signal; colours may differ on clones |
Pulse Sensor vs KY-039 vs MAX30102
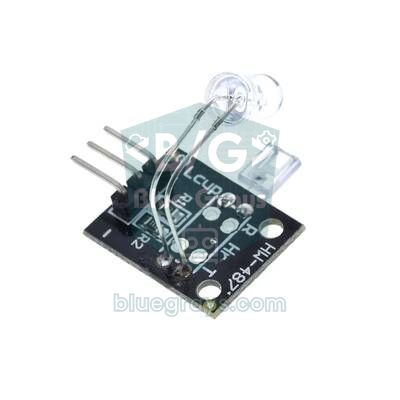
| Feature | Pulse Sensor | KY-039 | MAX30102 |
|---|---|---|---|
| Method | Reflective PPG | Transmissive PPG (finger in between) | Reflective PPG |
| Light | Green LED | Infrared LED | Red (660 nm) + infrared (880 nm) |
| Amplifier and filter | Yes (op-amp) | No | Built-in 18-bit ADC, ambient light cancellation |
| Output | Analog | Analog (very weak) | Digital, I2C (address 0x57) |
| Supply | 3–5 V | 3.3–5 V | 3.3–5 V depending on the module |
| Signal quality | Good | Weak, noise-prone | Very good |
| SpO2 (oxygen) | No | No | Yes (with an algorithm) |
| Library | PulseSensor Playground | No ready-made library | SparkFun MAX3010x |
If you're a beginner and only want to measure your pulse, the Pulse Sensor is the easiest choice: because the signal is amplified and filtered on the board, you'll see a clear wave in the Serial Plotter on your first try. The op-amp on the back raises this small change to a level the Arduino can read; you can try out how such a gain is calculated with the Op-amp tool. The KY-039 is cheap and comes in most sensor kits, but its output moves by only a few ADC steps, so simple fixed-threshold code won't give reliable results. If you also want to measure blood oxygen saturation (SpO2), the right choice is the MAX30102; we cover it in its own section below.
Pulse sensor wiring: Arduino Uno, ESP32 and Pico
| Sensor pin | Arduino Uno | ESP32 | Raspberry Pi Pico |
|---|---|---|---|
| + (VCC, red) | 5V | 3V3 | 3V3(OUT), pin 36 |
| − (GND, black) | GND | GND | GND, pin 38 |
| S (signal, purple) | A0 | GPIO 34 (ADC1) | GP26 (ADC0), pin 31 |
| Beat LED (optional) | D13 (built-in LED) | GPIO 2 (built-in LED) | On-board LED |
The same table applies to the KY-039: the S pin goes to the analog input, + to the supply and − to GND. Make sure the infrared LED is bent over the phototransistor and that your finger fits between them. The components on the back of the Pulse Sensor are exposed; if a finger or a sweaty surface touches the back, it causes noise. That's why it's a good habit to stick the clear sticker that comes with the kit on the front and cover the back with hot glue. If you use an external LED, calculate its resistor with the LED resistor tool; you can also see your board's pin map in the Pinout tool.
First test: seeing the raw pulse wave in the Serial Plotter
Before moving on to BPM, check that the sensor really sees a pulse. The code below uses no library; it reads the signal 100 times a second and sends it to the Serial Plotter. Upload the code, open Tools > Serial Plotter in the Arduino IDE and set the speed to 115200 baud. If you haven't used the Serial Plotter before, the Arduino Serial Monitor article explains how the window works.
1// Nabız sensörü ham sinyal testi (Seri Çizici) / Pulse sensor raw signal test (Serial Plotter)
2const int PULSE_PIN = A0;              // sensörün S (mor) kablosu / sensor S (purple) wire
3const unsigned long PERIOD_MS = 10;    // 10 ms = saniyede 100 örnek / 10 ms = 100 samples per second
4
5unsigned long lastSample = 0;
6
7void setup() {
8  Serial.begin(115200);                // Seri Çizici'de de 115200 seç / pick 115200 in the Serial Plotter too
9  lastSample = millis();
10}
11
12void loop() {
13  if (millis() - lastSample >= PERIOD_MS) {
14    lastSample += PERIOD_MS;           // sabit aralıkla örnekle / sample at a fixed interval
15    int raw = analogRead(PULSE_PIN);   // 0-1023 arası değer / value between 0 and 1023
16    Serial.print("Sinyal:");
17    Serial.print(raw);
18    Serial.println(",Orta:512");       // boştaki orta seviye çizgisi / idle midpoint line
19  }
20}
With no finger on it, the Pulse Sensor's line sits flat around 512 with a little jitter; that's half the supply and shows the sensor is wired correctly. When you rest your fingertip lightly on the sensor, within a few seconds a wave appears that rises quickly and falls slowly with every heartbeat; its amplitude is usually between 100 and 300 steps. If you don't see the wave, don't move on to the BPM code: fix the wiring, the supply and the finger pressure first. If the peaks turn into a flat line stuck at 0 or 1023, the signal is clipping; usually the finger is moving or the sensor is pressed too hard. If you're curious where the 0–1023 range of an analog reading comes from, see the ADC and analog-to-digital conversion article.
Measuring BPM with PulseSensorPlayground
- Open the Library Manager in the Arduino IDE, search for PulseSensor Playground and install it. For details on installing libraries, see the how to add a library to Arduino article.
- Wire the sensor as in the table: + to 5V, − to GND and S to A0.
- Upload the code below and open the Serial Plotter at 115200 baud; the first line shows the raw signal and the second shows the BPM value.
- Put your finger on the sensor, rest your hand on the table and stay still for 10 seconds; the library settles its average over the first few beats.
- If you'd rather see the numbers line by line in the Serial Monitor, set the PLOTTER constant in the code to false; the BPM and the time between beats (IBI) are then printed on every beat.
1// PulseSensor Playground ile BPM ölçme / Measuring BPM with PulseSensor Playground
2#include <PulseSensorPlayground.h>
3
4const int PULSE_PIN = A0;              // sensörün S (mor) kablosu / sensor S (purple) wire
5const int LED_PIN = LED_BUILTIN;       // her atışta yanan LED (D13) / LED lit on each beat (D13)
6const int THRESHOLD = 550;             // başlangıç eşiği, boşta ~512 / starting threshold, idle ~512
7const bool PLOTTER = true;             // true: Seri Çizici, false: Seri Monitör / true: Serial Plotter, false: Serial Monitor
8
9PulseSensorPlayground pulseSensor;     // kütüphane nesnesi / library object
10unsigned long lastPrint = 0;
11
12void setup() {
13  Serial.begin(115200);
14  pulseSensor.analogInput(PULSE_PIN);
15  pulseSensor.blinkOnPulse(LED_PIN);
16  pulseSensor.setThreshold(THRESHOLD);
17  if (!pulseSensor.begin()) {          // 2 ms'lik zamanlayıcıyı başlatır / starts the 2 ms timer
18    Serial.println(F("PulseSensor baslatilamadi / could not start"));
19    while (true) {}
20  }
21}
22
23void loop() {
24  // Atış anı: BPM ve atışlar arası süre / moment of a beat: BPM and inter-beat interval
25  if (pulseSensor.sawStartOfBeat() && !PLOTTER) {
26    Serial.print(F("BPM: "));
27    Serial.print(pulseSensor.getBeatsPerMinute());
28    Serial.print(F("  IBI: "));
29    Serial.print(pulseSensor.getInterBeatIntervalMs());
30    Serial.println(F(" ms"));
31  }
32
33  // 20 ms'de bir çizim satırı / one plotter line every 20 ms
34  if (PLOTTER && millis() - lastPrint >= 20) {
35    lastPrint = millis();
36    Serial.print(F("Sinyal:"));
37    Serial.print(pulseSensor.getLatestSample());
38    Serial.print(F(",BPM:"));
39    Serial.println(pulseSensor.getBeatsPerMinute());
40  }
41}| Function | What it does |
|---|---|
| analogInput(pin) | Selects the analog pin the sensor is connected to (A0 by default) |
| blinkOnPulse(pin) | Lights the LED on this pin while the signal is above the threshold, i.e. during each beat |
| fadeOnPulse(pin) | Lights the LED on a PWM pin with each beat and fades it out slowly |
| setThreshold(value) | Starting threshold; when no beat is found, the threshold returns to this value |
| begin() | Starts sampling; returns true on success |
| sawStartOfBeat() | Returns true if a new beat has started since the last call |
| getBeatsPerMinute() | BPM calculated from the average of the last 10 beat intervals |
| getInterBeatIntervalMs() | Time between the last two beats (IBI), in milliseconds |
| getLatestSample() | The latest raw reading (0–1023) |
| isInsideBeat() | Returns true while the signal is above the threshold |
The library reads the sensor in the background with a timer interrupt every 2 ms (500 times a second), so sampling stays steady even if you do long tasks in loop(). On every beat it records the peak and trough of the wave and moves the threshold to exactly halfway between them; in other words, the value you give setThreshold() is only a starting point. It ignores rises that come within 250 ms of the previous beat or before three-fifths of the last beat interval has passed, so the dicrotic notch isn't counted as a second beat. BPM is calculated from the average of the last 10 beat intervals; if no beat is found for 2.5 seconds, everything resets and getBeatsPerMinute() returns 0.
Choose the starting threshold by looking at the raw signal: 30–50 steps above the highest value the line reaches with no finger is a good start (between 530 and 600 on most sensors). If the threshold is too low, noise is counted as beats even with no finger; if it's too high, weak pulses are missed. One more warning: on the Arduino Uno the library uses Timer1 for sampling, so analogWrite() doesn't work on pins 9 and 10. If you add the Servo library to your project, the library switches to Timer2; then PWM on pins 3 and 11 and the tone() function are affected instead.
For an accurate reading: finger pressure, ambient light and movement
Most of the things that spoil a pulse reading have to do with how the sensor is held, not with the code. Try the points below one by one with the Serial Plotter open; seeing how each one changes the wave is the fastest way to understand the sensor.
- Finger pressure: press lightly but steadily. If you touch it too lightly, every twitch of your finger creates noise bigger than the wave; if you press too hard, you squeeze the capillaries, blood flow drops and the wave flattens or even disappears. The best results come from wrapping the sensor around your finger with a Velcro strap.
- Ambient light: sunlight and lamps leak into the sensor from the side. On 50 Hz mains many lamps flicker 100 times a second (120 times on 60 Hz mains), and this flicker gets into the signal. Cover the area around the sensor completely with your finger or wrap a dark band over it.
- Movement: a swinging cable, talking, moving your finger or walking produces signals much bigger than the pulse. Rest your hand on the table and keep still while measuring.
- Cold hands: in a cold finger the vessels narrow and the signal gets weaker. Warm up your hands or clip the sensor to your earlobe; the earlobe is also less affected by movement.
- Sweat and oil: moist skin scatters light differently and dirties the sensor's surface. Use the clear protective sticker on the front and wipe the sensor now and then with a dry cloth.
- Settling time: during the first 5–10 seconds after you place your finger, the signal settles and the average fills up; ignore the values you see during that time.
Heart rate display on an OLED
The Serial Plotter is fine on a desk, but a portable heart rate monitor needs a small screen. The code below draws the BPM in big digits and a heart icon that grows on each beat at the top of a 0.96-inch SSD1306 OLED, and a live pulse wave sweeping from left to right at the bottom. Connect the OLED to the Uno's A4 (SDA) and A5 (SCL) pins and its power to 5V and GND; installing the display library and setting the address are explained in detail in the How to Use an OLED Display (SSD1306) article.
1// Pulse Sensor + 0,96" OLED: BPM, kalp simgesi ve nabız dalgası / BPM, heart icon and pulse wave
2#include <Wire.h>
3#include <Adafruit_GFX.h>
4#include <Adafruit_SSD1306.h>
5#include <PulseSensorPlayground.h>
6
7Adafruit_SSD1306 display(128, 64, &Wire, -1);  // 128x64, reset pini yok / no reset pin
8PulseSensorPlayground pulseSensor;
9
10const int PULSE_PIN = A0;              // sensörün S pini / sensor S pin
11const int THRESHOLD = 550;             // başlangıç eşiği / starting threshold
12const int GRAPH_TOP = 24;              // dalga alanının üst kenarı / top edge of the wave area
13const int GRAPH_H = 40;                // dalga alanının yüksekliği / height of the wave area
14
15int x = 0;                             // tarama sütunu (0-127) / sweep column (0-127)
16int lastY = GRAPH_TOP + GRAPH_H / 2;   // önceki noktanın y'si / y of the previous point
17int lo = 1023, hi = 0;                 // bu taramadaki en küçük/büyük değer / min/max in this sweep
18int scaleLo = 400, scaleHi = 624;      // çizimde kullanılan aralık / range used for drawing
19unsigned long lastDraw = 0, beatTime = 0;
20
21// İki daire ve bir üçgenle kalp çiz / draw a heart from two circles and a triangle
22void drawHeart(int cx, int cy, bool big) {
23  int r = big ? 6 : 4;                 // atış anında büyük kalp / bigger heart on a beat
24  display.fillCircle(cx - r, cy - r / 2, r, SSD1306_WHITE);
25  display.fillCircle(cx + r, cy - r / 2, r, SSD1306_WHITE);
26  display.fillTriangle(cx - 2 * r, cy, cx + 2 * r, cy, cx, cy + 2 * r, SSD1306_WHITE);
27}
28
29void setup() {
30  Serial.begin(115200);
31  if (!display.begin(SSD1306_SWITCHCAPVCC, 0x3C)) {  // I2C adresi 0x3C / I2C address 0x3C
32    Serial.println(F("SSD1306 allocation failed"));
33    while (true) {}
34  }
35  display.clearDisplay();
36  pulseSensor.analogInput(PULSE_PIN);
37  pulseSensor.setThreshold(THRESHOLD);
38  pulseSensor.begin();                 // örnekleme kesmeyle sürer / sampling runs in an interrupt
39}
40
41void loop() {
42  if (pulseSensor.sawStartOfBeat()) beatTime = millis();  // atış anını sakla / store the beat time
43
44  if (millis() - lastDraw < 40) return; // saniyede 25 kare / 25 frames per second
45  lastDraw = millis();
46
47  // Alt bölüm: soldan sağa taranan nabız dalgası / bottom: pulse wave swept left to right
48  int s = pulseSensor.getLatestSample();
49  if (s < lo) lo = s;
50  if (s > hi) hi = s;
51  int y = map(constrain(s, scaleLo, scaleHi), scaleLo, scaleHi, GRAPH_TOP + GRAPH_H - 1, GRAPH_TOP);
52  display.drawFastVLine(x, GRAPH_TOP, GRAPH_H, SSD1306_BLACK);              // eski sütunu sil / erase the old column
53  display.drawFastVLine((x + 1) % 128, GRAPH_TOP, GRAPH_H, SSD1306_BLACK);  // önündeki boşluk / gap ahead
54  if (x > 0) display.drawLine(x - 1, lastY, x, y, SSD1306_WHITE);
55  lastY = y;
56  if (++x >= 128) {                    // tarama bitti: ölçeği yenile / sweep done: refresh the scale
57    x = 0;
58    if (hi - lo > 20) { scaleLo = lo; scaleHi = hi; }
59    lo = 1023;
60    hi = 0;
61  }
62
63  // Üst bölüm: kalp ve BPM / top: heart and BPM
64  display.fillRect(0, 0, 128, GRAPH_TOP, SSD1306_BLACK);
65  drawHeart(14, 10, millis() - beatTime < 150);
66  int bpm = pulseSensor.getBeatsPerMinute();
67  display.setTextColor(SSD1306_WHITE);
68  display.setTextSize(3);
69  display.setCursor(40, 0);
70  if (bpm > 0) display.print(bpm);
71  else display.print(F("--"));         // parmak yok / no finger
72  display.setTextSize(1);
73  display.setCursor(104, 14);
74  display.print(F("BPM"));
75  display.display();                   // tamponu ekrana gönder / push the buffer to the screen
76}
The code refreshes the screen 25 times a second and adds one point to the wave in each frame, so the width of the screen shows about 5 seconds of pulse recording. At the end of each sweep the wave is rescaled to the smallest and largest value of that sweep, so a weak or a strong signal fits on the screen. Sending one frame to the display over I2C takes about 25–30 ms, but because the library samples in an interrupt, no beat is missed in the meantime. On the Uno the display buffer takes 1 KB of RAM; since the code draws the wave straight to the screen without storing it in an array, the memory is enough, though only about 450 bytes remain free.
Measuring heart rate with the KY-039
On the KY-039 the phototransistor is connected in series with a resistor, and the output voltage changes with the light it receives: more light means a lower voltage, less light a higher one. There's no amplifier or filter in between. With a finger in place, a heartbeat usually moves this voltage by only 2–10 ADC steps, about 10–50 mV; even a small change in ambient light is bigger than that. That's why code written for the Pulse Sensor and a fixed threshold like 550 don't work on the KY-039; you need to clean up the signal first and then use a threshold that adapts to the size of the wave itself.
The code below does this in four steps. First it reads the analog pin non-stop for 20 ms (about 175 readings) and averages them; this reduces random noise and, because 20 ms is exactly one period of 50 Hz mains, almost completely cancels lamp flicker. Then it smooths the signal with a light low-pass filter and removes the DC level with a very slow moving average, leaving only the pulse wave. In the third step it calculates two envelopes that follow the wave's peaks and troughs and puts the threshold halfway between them. Finally, a beat is counted when the signal crosses the threshold upwards, and BPM is found from the average of the last 8 beat intervals.
1// KY-039 ile nabız ölçme (kütüphanesiz) / Heart rate with the KY-039 (no library)
2const int SENSOR_PIN = A0;             // KY-039 S pini / KY-039 S pin
3const int LED_PIN = LED_BUILTIN;       // atışta yanan LED / LED lit on each beat
4const bool PLOTTER = true;             // true: Seri Çizici, false: Seri Monitör / true: Serial Plotter, false: Serial Monitor
5const unsigned long WINDOW_US = 20000; // 20 ms = 50 Hz şebekenin bir periyodu / one period of 50 Hz mains
6const float MIN_AMP = 1.2;             // tepe-tepe gürültü sınırı (ADC birimi) / peak-to-peak noise limit (ADC units)
7const int AVG_BEATS = 8;               // BPM için ortalanan aralık sayısı / intervals averaged for BPM
8
9float smooth, baseline;                // süzülmüş sinyal ve DC seviye / filtered signal and DC level
10float posEnv = 0, negEnv = 0;          // tepe ve çukur zarfları / peak and trough envelopes
11bool armed = true;                     // yeni atışa hazır mı / ready for a new beat
12unsigned long lastBeat = 0;            // son atışın zamanı / time of the last beat
13unsigned int ibi[AVG_BEATS];           // atışlar arası süreler (ms) / inter-beat intervals (ms)
14int ibiCount = 0, ibiIndex = 0, bpm = 0;
15
16// 20 ms boyunca okuyup ortalama al / read for 20 ms and average
17float readWindow() {
18  unsigned long start = micros();
19  long sum = 0;
20  int n = 0;
21  while (micros() - start < WINDOW_US) {
22    sum += analogRead(SENSOR_PIN);
23    n++;
24  }
25  return (float)sum / n;
26}
27
28float averageIbi() {
29  if (ibiCount == 0) return 500.0;     // geçmiş yoksa 120 BPM varsay (ilk bekleme 350 ms) / assume 120 BPM without history (first wait 350 ms)
30  unsigned long sum = 0;
31  for (int i = 0; i < ibiCount; i++) sum += ibi[i];
32  return (float)sum / ibiCount;
33}
34
35void addInterval(unsigned int ms) {
36  ibi[ibiIndex] = ms;                  // halka tampon / ring buffer
37  ibiIndex = (ibiIndex + 1) % AVG_BEATS;
38  if (ibiCount < AVG_BEATS) ibiCount++;
39  bpm = (int)(60000.0 / averageIbi() + 0.5);
40}
41
42void setup() {
43  Serial.begin(115200);
44  pinMode(LED_PIN, OUTPUT);
45  smooth = baseline = readWindow();    // başlangıç seviyesi / starting level
46}
47
48void loop() {
49  float x = readWindow();              // saniyede 50 örnek / 50 samples per second
50  unsigned long now = millis();
51
52  smooth += (x - smooth) * 0.5;        // hafif alçak geçiren süzgeç / light low-pass filter
53  baseline += (smooth - baseline) * 0.05;  // yavaş DC takibi (~0,4 s) / slow DC tracking (~0.4 s)
54  float ac = smooth - baseline;        // yalnız nabız dalgası / pulse wave only
55
56  // Zarflar: uçları hemen yakala, yavaşça bırak / envelopes: catch extremes fast, release slowly
57  posEnv = (ac > posEnv) ? ac : posEnv * 0.99;
58  negEnv = (ac < negEnv) ? ac : negEnv * 0.99;
59  float amp = posEnv - negEnv;         // tepe-tepe genlik / peak-to-peak amplitude
60  float mid = (posEnv + negEnv) / 2;   // eşik: dalganın ortası / threshold: middle of the wave
61
62  unsigned long sinceBeat = now - lastBeat;
63  float refractory = constrain(averageIbi() * 0.7, 250.0, 600.0);  // dikrotik çentiği atla / skip the dicrotic notch
64
65  if (armed && amp > MIN_AMP && ac > mid && sinceBeat > refractory) {
66    armed = false;                     // atış bulundu / beat found
67    digitalWrite(LED_PIN, HIGH);
68    if (sinceBeat < 2000) addInterval(sinceBeat);  // 30 BPM'den yavaşı alma / ignore gaps slower than 30 BPM
69    lastBeat = now;
70    if (!PLOTTER && bpm > 0) {
71      Serial.print(F("BPM: "));
72      Serial.println(bpm);
73    }
74  }
75  if (!armed && ac < mid - amp * 0.25) {  // dalga yeterince indi: yeniden hazır / wave fell enough: re-arm
76    armed = true;
77    digitalWrite(LED_PIN, LOW);
78  }
79  if (sinceBeat > 2500 && ibiCount > 0) {  // 2,5 s atış yok: sıfırla / no beat for 2.5 s: reset
80    ibiCount = 0;
81    bpm = 0;
82  }
83
84  if (PLOTTER) {
85    Serial.print(F("Nabiz:"));
86    Serial.print(ac);
87    Serial.print(F(",Esik:"));
88    Serial.println(mid);
89  }
90}| Constant / value | What it does |
|---|---|
| WINDOW_US = 20000 | Averaging window; cancels 50 Hz mains flicker (use 16667 in 60 Hz countries) |
| 0.5 (smooth) | Light low-pass filter; smooths sudden jumps |
| 0.05 (baseline) | Follows the DC level in about 0.4 seconds; removes slow changes in finger pressure |
| 0.99 (envelopes) | Release speed of the peak and trough envelopes (about 2 seconds) |
| MIN_AMP = 1.2 | A wave below this peak-to-peak amplitude counts as noise |
| refractory | 70% of the latest average interval (250–600 ms; 350 ms while there is no history yet, so a fast pulse isn't missed); stops the dicrotic notch from counting as a second beat |
| mid - amp * 0.25 | Re-arm level; no new beat is searched for until the wave has fallen far enough |
When you upload the code and open the Serial Plotter, you'll see two lines: Nabiz (pulse) shows the cleaned-up wave and Esik (threshold) the adaptive threshold running through its middle. Check how much the Nabiz line moves with no finger and set MIN_AMP a little above that peak-to-peak value; lower it if your signal is very weak. For more on smoothing signals, see the sensor data filtering article. The same code works with the Pulse Sensor too; in that case just raise MIN_AMP to around 20.
Pulse sensor with the ESP32
On the ESP32, power the sensor from the 3V3 pin and connect the signal to GPIO 34. This pin belongs to the ADC1 group; ADC2 pins can't be read while Wi-Fi is on, so if you're going to send pulse data over the internet, you must pick one of the ADC1 pins (GPIO 32–39). The ESP32's ADC is 12-bit (0–4095), and with a 3.3 V supply the Pulse Sensor gives a value around 2000 at idle.
Recent versions of PulseSensorPlayground support the ESP32 too, but the library uses the timer functions of version 3.x of the ESP32 board package and doesn't compile with version 2.x. In its examples it lowers the ADC to 10 bits with analogReadResolution(10), so the threshold is given on the same 0–1023 scale as on the Uno (685 in the ESP32 example). To stay clear of version differences, below is a library-free sketch that uses the same algorithm as the KY-039 section; it works with both versions of the board package.
1// ESP32 + Pulse Sensor: kütüphanesiz BPM / BPM without a library
2const int SENSOR_PIN = 34;             // ADC1 pini, Wi-Fi açıkken de çalışır / ADC1 pin, works with Wi-Fi on
3const int LED_PIN = 2;                 // çoğu DevKit'te dahili LED / built-in LED on most DevKits
4const unsigned long PERIOD_MS = 10;    // saniyede 100 örnek / 100 samples per second
5const float MIN_AMP = 80;              // 12 bitte tepe-tepe gürültü sınırı / peak-to-peak noise limit in 12-bit units
6const int AVG_BEATS = 8;               // BPM için ortalanan aralık sayısı / intervals averaged for BPM
7
8float smooth, baseline, posEnv = 0, negEnv = 0;
9bool armed = true;
10unsigned long lastSample = 0, lastBeat = 0;
11unsigned long ibi[AVG_BEATS];
12int ibiCount = 0, ibiIndex = 0, bpm = 0;
13
14// 8 okumanın ortalaması: ESP32 ADC'si gürültülüdür / average of 8 reads: the ESP32 ADC is noisy
15float readSensor() {
16  long sum = 0;
17  for (int i = 0; i < 8; i++) sum += analogRead(SENSOR_PIN);
18  return sum / 8.0;
19}
20
21float averageIbi() {
22  if (ibiCount == 0) return 500.0;     // geçmiş yoksa 120 BPM varsay (ilk bekleme 350 ms) / assume 120 BPM without history (first wait 350 ms)
23  unsigned long sum = 0;
24  for (int i = 0; i < ibiCount; i++) sum += ibi[i];
25  return (float)sum / ibiCount;
26}
27
28void setup() {
29  Serial.begin(115200);
30  pinMode(LED_PIN, OUTPUT);
31  analogReadResolution(12);            // 0-4095 arası değer / values from 0 to 4095
32  smooth = baseline = readSensor();
33  lastSample = millis();
34}
35
36void loop() {
37  if (millis() - lastSample < PERIOD_MS) return;
38  lastSample += PERIOD_MS;             // sabit aralıkla örnekle / sample at a fixed interval
39  unsigned long now = millis();
40
41  float x = readSensor();
42  smooth += (x - smooth) * 0.3;        // alçak geçiren süzgeç (~6 Hz) / low-pass filter (~6 Hz)
43  baseline += (smooth - baseline) * 0.02;  // DC takibi (~0,5 s) / DC tracking (~0.5 s)
44  float ac = smooth - baseline;
45
46  posEnv = (ac > posEnv) ? ac : posEnv * 0.995;  // tepe zarfı / peak envelope
47  negEnv = (ac < negEnv) ? ac : negEnv * 0.995;  // çukur zarfı / trough envelope
48  float amp = posEnv - negEnv;
49  float mid = (posEnv + negEnv) / 2;
50
51  unsigned long sinceBeat = now - lastBeat;
52  float refractory = constrain(averageIbi() * 0.7, 250.0, 600.0);
53
54  if (armed && amp > MIN_AMP && ac > mid && sinceBeat > refractory) {
55    armed = false;
56    digitalWrite(LED_PIN, HIGH);
57    if (sinceBeat < 2000) {            // 30-240 BPM aralığı / 30-240 BPM range
58      ibi[ibiIndex] = sinceBeat;
59      ibiIndex = (ibiIndex + 1) % AVG_BEATS;
60      if (ibiCount < AVG_BEATS) ibiCount++;
61      bpm = (int)(60000.0 / averageIbi() + 0.5);
62      Serial.printf("BPM: %d  IBI: %lu ms\n", bpm, sinceBeat);
63    }
64    lastBeat = now;
65  }
66  if (!armed && ac < mid - amp * 0.25) {
67    armed = true;
68    digitalWrite(LED_PIN, LOW);
69  }
70  if (sinceBeat > 2500 && ibiCount > 0) {  // parmak çekildi / finger removed
71    ibiCount = 0;
72    bpm = 0;
73    Serial.println("Parmak yok / no finger");
74  }
75}
In this code the signal is read 100 times a second, and because the ESP32's ADC is noisy, each sample is the average of 8 readings. The threshold and envelope values are set for the 12-bit scale, so MIN_AMP is 80 (about 65 mV). The ESP32's real strength is Wi-Fi: you can stream the BPM live to a web page over WebSocket, send a Telegram message when the pulse crosses a limit, or log your readings to Google Sheets.
Measuring heart rate with the Raspberry Pi Pico and MicroPython
On the Raspberry Pi Pico, connect the sensor's + pin to 3V3(OUT) (pin 36), − to GND (pin 38) and S to GP26 (ADC0, pin 31). In MicroPython, read_u16() returns a value from 0 to 65535; the code shifts it right by 4 bits to bring it down to the same 0–4095 scale as the ESP32, so the threshold values stay the same on both boards. If you save the code to the Pico as main.py in Thonny, it runs on its own every time the board powers up.
1# Raspberry Pi Pico + Pulse Sensor: MicroPython ile BPM / BPM with MicroPython
2from machine import ADC, Pin
3import time
4
5sensor = ADC(26)                   # GP26 = ADC0, sensörün S pini / sensor S pin
6led = Pin("LED", Pin.OUT)          # kartın üzerindeki LED / on-board LED
7
8PERIOD_MS = 10                     # saniyede 100 örnek / 100 samples per second
9MIN_AMP = 80                       # 12 bitte tepe-tepe gürültü sınırı / peak-to-peak noise limit (12-bit)
10AVG_BEATS = 8                      # BPM için ortalanan aralık / intervals averaged for BPM
11
12def read12():
13    # 4 okumanın ortalaması, 0-4095 / average of 4 reads, 0-4095
14    s = 0
15    for _ in range(4):
16        s += sensor.read_u16() >> 4
17    return s / 4
18
19smooth = baseline = read12()
20pos_env = neg_env = 0.0
21armed = True
22ibis = []
23bpm = 0
24last_beat = time.ticks_ms()
25next_t = time.ticks_ms()
26
27while True:
28    while time.ticks_diff(time.ticks_ms(), next_t) < 0:
29        pass                       # bir sonraki örnek zamanını bekle / wait for the next sample time
30    next_t = time.ticks_add(next_t, PERIOD_MS)
31    now = time.ticks_ms()
32
33    x = read12()
34    smooth += (x - smooth) * 0.3            # alçak geçiren süzgeç / low-pass filter
35    baseline += (smooth - baseline) * 0.02  # DC takibi / DC tracking
36    ac = smooth - baseline
37
38    pos_env = ac if ac > pos_env else pos_env * 0.995
39    neg_env = ac if ac < neg_env else neg_env * 0.995
40    amp = pos_env - neg_env
41    mid = (pos_env + neg_env) / 2
42
43    since = time.ticks_diff(now, last_beat)
44    avg_ibi = sum(ibis) / len(ibis) if ibis else 500   # geçmiş yoksa 120 BPM varsay / assume 120 BPM without history
45    refractory = min(max(avg_ibi * 0.7, 250), 600)   # dikrotik çentiği atla / skip the dicrotic notch
46
47    if armed and amp > MIN_AMP and ac > mid and since > refractory:
48        armed = False
49        led.on()
50        if since < 2000:                    # 30 BPM'den yavaşı alma / ignore gaps slower than 30 BPM
51            ibis.append(since)
52            if len(ibis) > AVG_BEATS:
53                ibis.pop(0)
54            bpm = round(60000 / (sum(ibis) / len(ibis)))
55            print("BPM:", bpm, "IBI:", since)
56        last_beat = now
57    if not armed and ac < mid - amp * 0.25:
58        armed = True
59        led.off()
60    if since > 2500 and ibis:               # parmak çekildi / finger removed
61        ibis = []
62        bpm = 0
63        print("Parmak yok / no finger")
The code works with the same logic as the ESP32 version: it takes a sample every 10 ms, removes the DC level, finds the beat with an adaptive threshold and calculates BPM from the average of the last 8 intervals. On each beat the on-board LED lights up, and the BPM and beat interval are printed in Thonny's Shell window. If Python syntax is new to you, the MicroPython basics article is a good place to start.
How it differs from the MAX30102: measuring blood oxygen (SpO2)
The MAX30102 is a single-chip sensor that Analog Devices (formerly Maxim Integrated) designed for measuring heart rate and blood oxygen saturation. Inside it are two LEDs, red (660 nm) and infrared (880 nm), a photodiode, an ambient light cancellation circuit and an 18-bit ADC. It does the measuring itself, stores the samples in a 32-sample memory (FIFO) and sends them as numbers over the I2C bus (address 0x57). Since noise picked up by analog wires and the Arduino's 10-bit ADC limit no longer matter, its signal is much cleaner than the Pulse Sensor's.
The secret of SpO2 measurement is using light of two different colours. Hemoglobin that carries oxygen absorbs more infrared and less red light; hemoglobin that has released its oxygen does the opposite. The sensor measures the AC and DC components of the pulse wave for both lights and calculates the ratio R = (AC_red / DC_red) / (AC_infrared / DC_infrared); SpO2 is found from this ratio with an empirical calibration curve. The Pulse Sensor and KY-039 use light of a single colour, so they can't calculate this ratio, which means they can't measure oxygen. The most popular Arduino library for the MAX30102 is SparkFun MAX3010x; its Example5_HeartRate example calculates heart rate and Example8_SPO2 calculates oxygen saturation.
A pulse sensor is not a medical device
There are concrete reasons for this. Medical heart rate monitors and pulse oximeters are calibrated to specific accuracy limits and tested on different skin tones, at low blood flow and during movement; hobby modules and the algorithms we write don't go through these tests. Also, measuring your pulse isn't the same as assessing your heart rhythm: understanding rhythm problems requires an ECG, which records the heart's electrical signal. As general information, the resting heart rate of an adult is usually between 60 and 100 beats per minute; in people who exercise regularly it can drop to 40–60. If your own reading falls outside this range, check the sensor and the code first; if you're still worried, talk to a doctor.
Pulse sensor project ideas
- Light that beats with your heart: on every beat, light a WS2812B LED ring red and fade it out slowly; shift the colour from blue to red as the BPM rises.
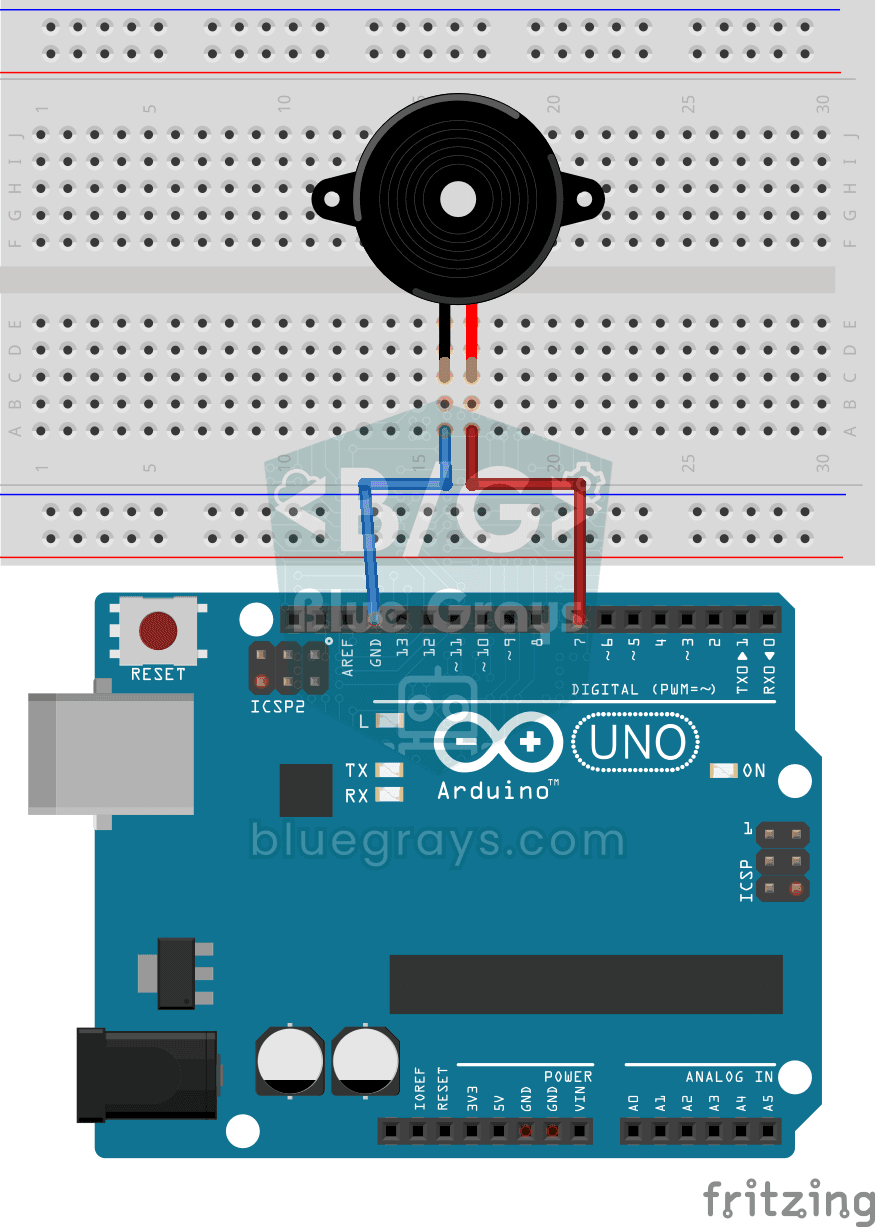
- Beeping heart rate monitor: play a short beep on a buzzer every time sawStartOfBeat() returns true; a fun project that imitates the sound of hospital monitors.
- Portable heart rate monitor: put the OLED code in a box with a battery and a charging circuit; switch the screen off when the measurement is done to make the battery last longer.
- Post-exercise recovery test: measure right after you finish exercising and calculate how many beats your pulse drops in the first minute; log the value every day and track your progress.
- Heart rate logger: write the BPM values with a timestamp to an SD card or send them to Excel and plot a chart.
- Breathing exercise game: show on screen how your pulse changes as you breathe slowly and deeply; you win when you bring your pulse below a target value.
Common mistakes and how to fix them
| Symptom | Likely cause | Fix |
|---|---|---|
| BPM always 0 or "--" | No beat detected: threshold too high, no finger, or S pin on the wrong input | Check the wave with the raw signal sketch; move the threshold to the middle of the wave |
| Very high BPM, like 150–220 | Noise or the dicrotic notch is counted as a second beat | Raise the threshold, steady your finger, block ambient light |
| BPM shows even with no finger | Threshold below the idle noise; lamp flicker getting into the signal | Set the threshold 30–50 steps above the highest idle value, cover the sensor |
| Signal stuck flat at 0 or 1023 | + and − swapped, broken wire, S pin in the wrong place or a faulty sensor | Check the wiring against the table; use 3V3 on the ESP32 and Pico |
| There's a wave but it keeps breaking up | Finger moving or pressure changing | Wrap the sensor with a Velcro strap, rest your hand on the table and keep still |
| No wave at all on the KY-039 | LED not bent over the phototransistor, or strong ambient light saturating the phototransistor | Bend the LED so it sits over your finger, use the sensor in the shade, lower MIN_AMP |
| "too few arguments to function 'hw_timer_t* timerBegin(uint8_t, uint16_t, bool)'" on the ESP32 | PulseSensorPlayground is being compiled with version 2.x of the ESP32 board package | Update the board package to 3.x or use the library-free ESP32 code in this article |
| analogWrite() doesn't work on pin 9 or 10 | The library uses Timer1 on the Uno | Use pins 3, 5, 6 or 11 for PWM |
A pulse sensor is one of those rare projects that teaches analog reading, signal filtering, timer interrupts and real-time plotting all at once with a single analog pin, and you see the result on your own body. If you'd like a beginner project that also measures light, the LDR light sensor is a good next step. In the BlueGrays app you'll find projects that use the parts in this article, such as reading light intensity with an LDR, the buzzer, ESP32 projects with an OLED display and a PWM breathing effect on the Pico, with step-by-step circuit diagrams and code.
Frequently asked questions
How accurate is an Arduino pulse sensor?
When it's held well and the person sits still, a Pulse Sensor usually measures the resting heart rate to within a few BPM. Movement, ambient light, cold hands and finger pressure quickly make the error bigger. The KY-039's signal is much weaker, so its readings jump around more; none of these sensors is suitable for medical measurement.
What's the difference between the Pulse Sensor and the KY-039?
The Pulse Sensor uses a green LED and the reflective method, amplifies and filters the signal with an op-amp on the board and idles at half the supply voltage. The KY-039 measures the infrared light passing through your finger, has no amplifier on the board and its output moves by only a few ADC steps. That's why the Pulse Sensor works easily with a ready-made library, while the KY-039 needs filtering and an adaptive threshold.
Can a pulse sensor measure blood oxygen (SpO2)?
Not the Pulse Sensor or the KY-039, because calculating SpO2 relies on comparing light at two different wavelengths, red and infrared. For that you need a sensor with two LEDs, such as the MAX30102. Even the MAX30102's reading is an uncalibrated estimate and doesn't replace a medical oximeter.
Why does my pulse sensor show very high or jumpy values?
The most common cause is noise or the dicrotic notch in the pulse wave being counted as a second beat; in that case the BPM comes out at roughly twice the real value. Raise the threshold, hold your finger in place with a Velcro strap and shield the sensor from light. Looking at the raw wave in the Serial Plotter shows the source of the problem right away.
Does the Pulse Sensor work with the ESP32 and Raspberry Pi Pico?
Yes, but on both boards you should power the sensor from the 3V3 pin, because their analog inputs can't take more than 3.3 V. On the ESP32 use an ADC1 pin such as GPIO 34 so it doesn't clash with Wi-Fi; on the Pico use GP26, GP27 or GP28. PulseSensorPlayground needs version 3.x of the ESP32 board package, and in MicroPython you write your own algorithm as shown in this article.
What is a normal heart rate?
In adults at rest the heart rate is usually between 60 and 100 beats per minute; in people who exercise regularly it can be 40–60, and in children it's higher. Your pulse naturally rises with exercise, stress, caffeine and fever. This is general information; talk to a doctor about your readings or any symptoms.
Projects to build after reading this
See all projects
Measuring Light Intensity with an LDR
Want to see how bright your room is as a number? The LDR, a small part that reacts to light, measures the light around it, and the Arduino writes the value to your computer screen every half second. C

Reading Light Intensity with the ESP32 LDR Module
Real-time monitoring of the LDR module's raw ADC value and relative light percentage calculated from dark and light reference values in the Serial Monitor. This percentage is not a lux measurement. Teaches the module’s calibration logic. It is ideal to complete this before Project 10, as it is used to determine the threshold value.
Using a Buzzer
Ever wondered how a doorbell or an alarm makes its sound? The Arduino makes a small buzzer beep at short intervals: beep, pause, beep, pause. You see how sound is made with electricity and take the fi
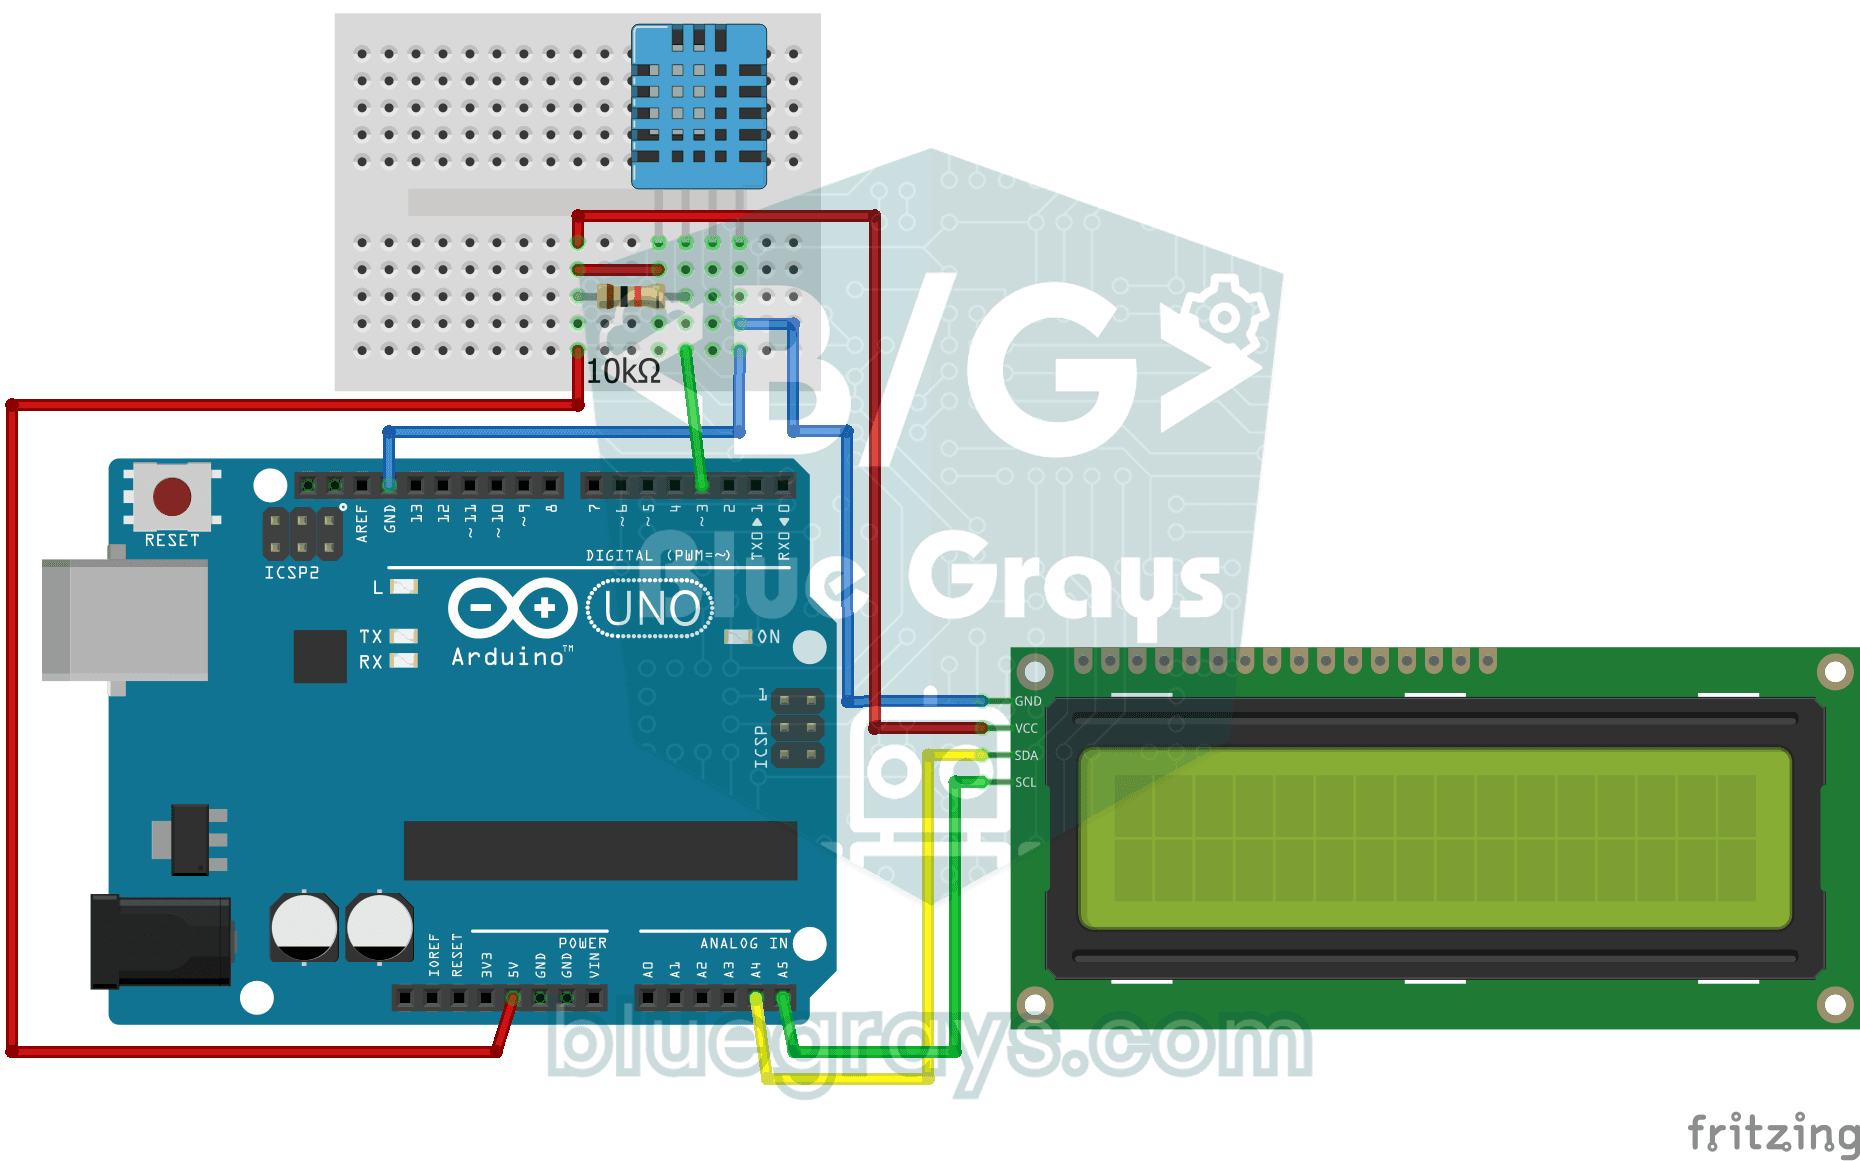
Temperature and Humidity with DHT11
How warm is your room, and is the air humid or dry? The DHT11 sensor measures temperature and humidity, and the Arduino writes the values on a two-line LCD screen, refreshing every couple of seconds.
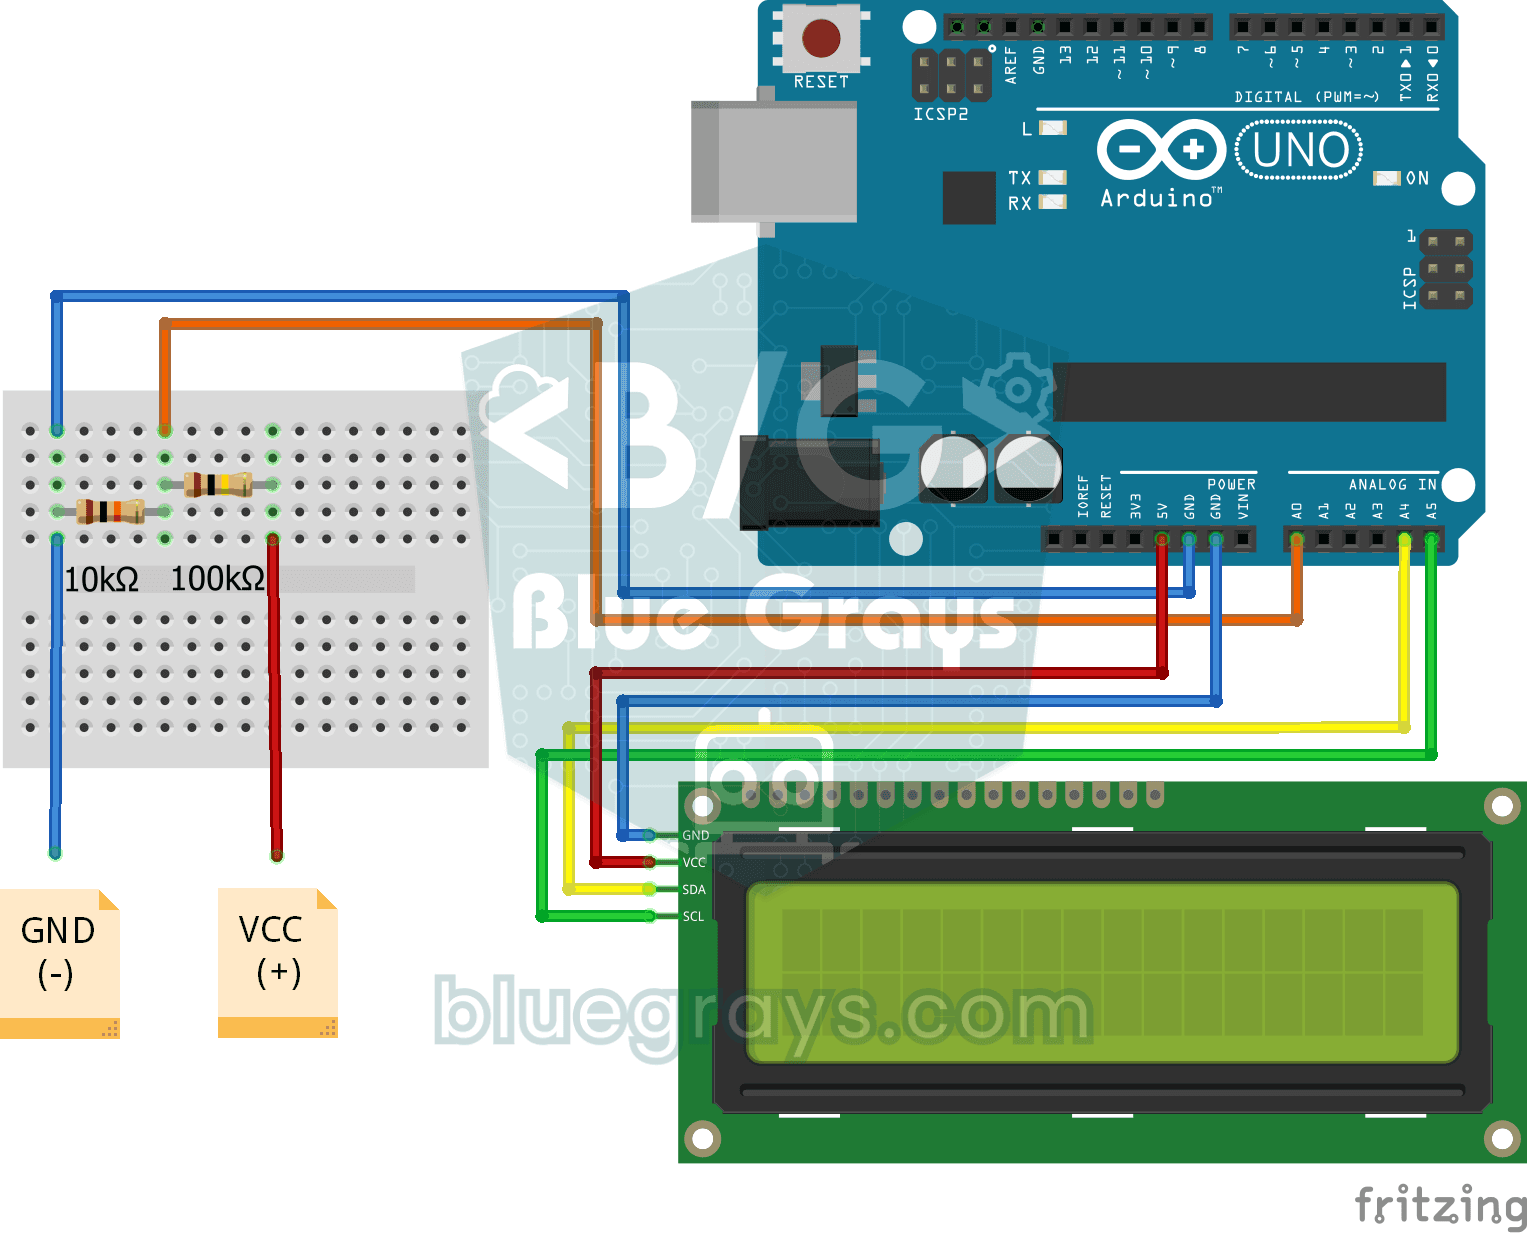
Digital Voltmeter with LCD Display
Find out how much voltage a battery or power adapter gives with a meter you built yourself. A divider made of two resistors brings high voltage down to a level the board can read, and the Arduino calc

ESP32 HTTPClient + Weather API (with SSD1306 OLED Display)
In this project, we use the ESP32 to make a REST API call to a weather API (wttr.in) over the internet using HTTPClient.h. Unlike the previous I2C LCD version, we’re using an SSD1306 OLED (128×64) display here—which allows for large fonts, vector icons, and rich visual presentation on a single screen. Seven different vector icons for weather conditions (sunny, partly cloudy, cloudy, rainy, snowy, stormy, foggy) are drawn at runtime (no bitmap files required). The temperature is displayed in th

ESP32 Deep Sleep — Battery Saving (OLED + RTC RAM Counter)
The ESP32's Deep Sleep mode reduces current consumption to ~10 µA by shutting down the CPU and most peripherals, making it critical for battery-powered IoT devices. In this project, we use three different wake-up sources: a timer (15 seconds), an external pin (EXT0 — button GPIO 33), and touch (T0/GPIO 4). Variables marked with RTC_DATA_ATTR are preserved during deep sleep—the boot counter, timer wake counter, and button wake counter are continuously tracked. On each wake-up, the SSD1306 OLED
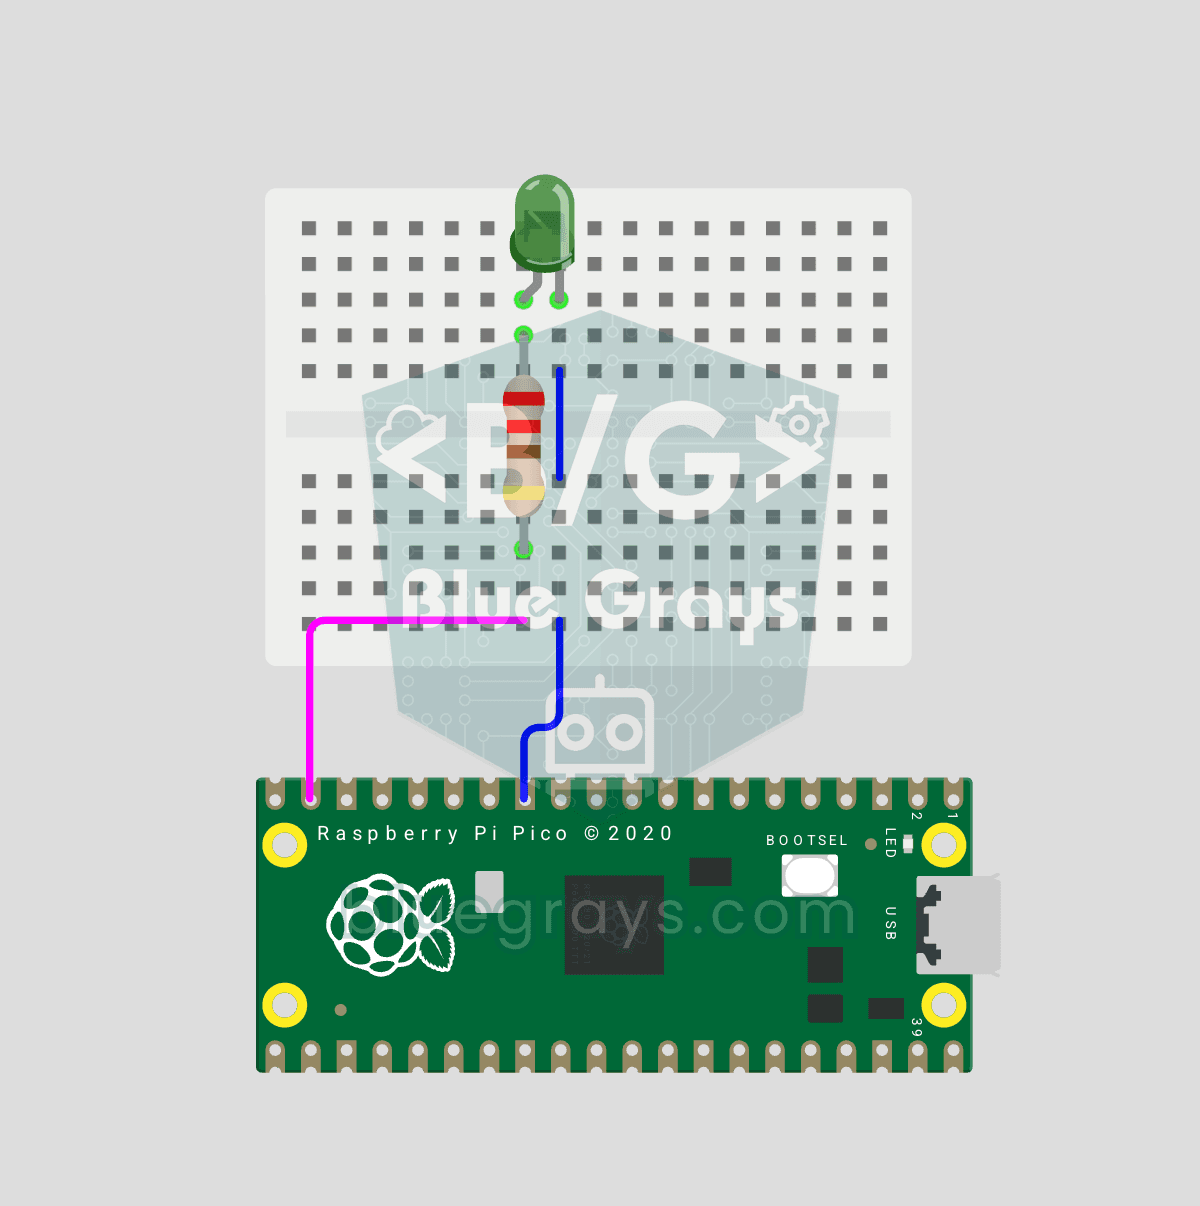
Raspberry Pi Pico PWM LED Fade (Breathing Effect)
The LED no longer just blinks — it breathes! Using the Raspberry Pi Pico's PWM (Pulse Width Modulation), the LED brightness slowly rises and then slowly falls, like a sleeping MacBook's light. Learn the machine.PWM class, duty_u16() (16-bit brightness 0–65535), PWM frequency (freq(1000) — 1000 on/off cycles per second, no visible flicker), range() step loops (up and down) and analog-like output from a digital pin. PWM is a core embedded tool — RGB color mixing, motor