
Arduino Data to Excel: Data Streamer, PLX-DAQ, CSV and Python
Send Arduino data to Excel four ways: Serial Monitor to CSV, Data Streamer, PLX-DAQ and Python logging, plus timestamps, charts and a lab report data table.
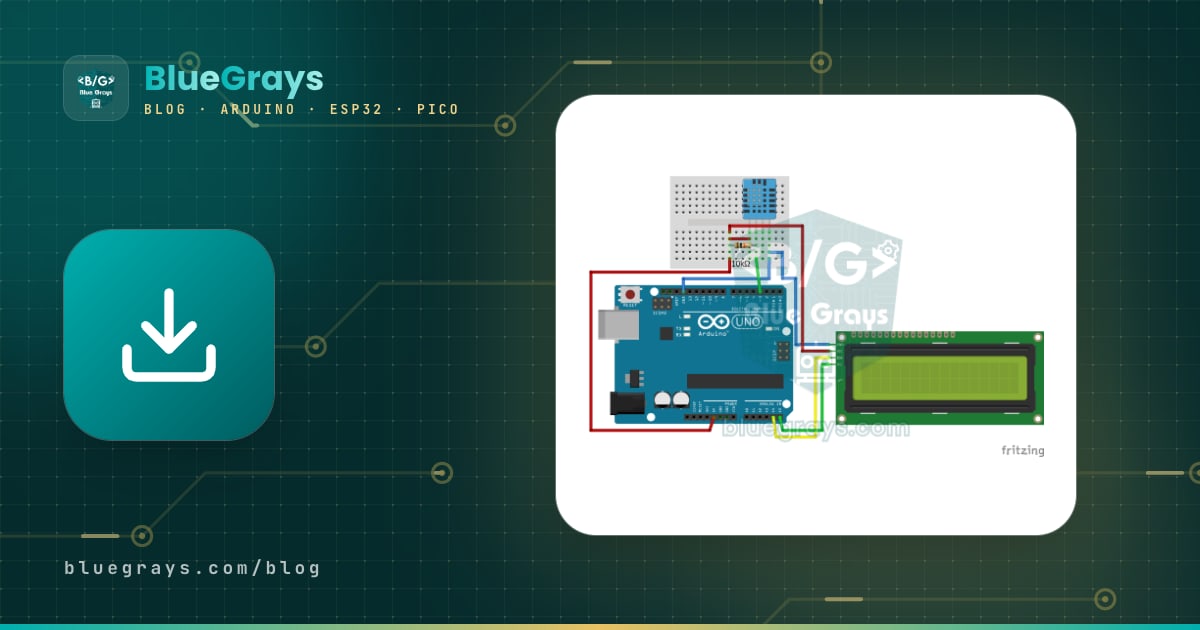
Getting Arduino data into Excel means sending the values your Arduino reads from its sensors to a computer over the USB cable and collecting them row by row in a spreadsheet. The Arduino writes each reading to the serial port as a single comma-separated line; on the computer there are four common ways to bring those lines into Excel: saving the Serial Monitor output as a CSV file, Microsoft's Data Streamer add-in, the PLX-DAQ macro, and automatic logging with Python. The idea is the same in every case: each line the Arduino sends becomes a row in Excel, and each comma starts a new column.
In this guide we use a DHT11 temperature and humidity sensor and an LDR light sensor as the example. First we compare the four methods so you can pick the right one, then we set each of them up step by step. After that you'll see how to add timestamps to your readings, how to choose the right chart type in Excel, and how to build a lab report data table you can use at school or for a science fair. The final sections show how to do the same with an ESP32 and a Raspberry Pi Pico, and how to fix the most common errors.
How does sending Arduino data to Excel work?
The Arduino can't write to Excel directly; all it does is send text to the serial port with Serial.print(). The computer reaches that port under a name like COM3 on Windows, /dev/cu.usbmodem… on macOS or /dev/ttyACM0 on Linux. The common language between Excel and the Arduino is CSV (Comma Separated Values): a line such as 12.0,23.0,45,78 is split into four columns. So your sketch only needs to follow two rules: always put the same separator between values, and end every reading with Serial.println(). You'll find the serial port basics in detail in the Arduino Serial Monitor guide.
| Method | Platform | Live transfer | Time information | Best for |
|---|---|---|---|---|
| Serial Monitor + CSV | Windows, macOS, Linux | No, copied after the test | The IDE's timestamp option | Short experiments, quick checks |
| Excel Data Streamer | Windows, Microsoft 365 desktop Excel | Yes | millis() sent by the Arduino | Live charts in the classroom |
| PLX-DAQ v2 | Windows, desktop Excel (macro) | Yes | DATE, TIME and TIMER commands | Long logging into a ready-made sheet |
| Python (pyserial + openpyxl) | Windows, macOS, Linux | Yes, to a file | Computer clock | Automatic reports, logging for hours |
| SD card module | No computer needed | No, the card is read later | RTC module | Field measurements on battery power |
Example circuit: wiring the DHT11 and the LDR
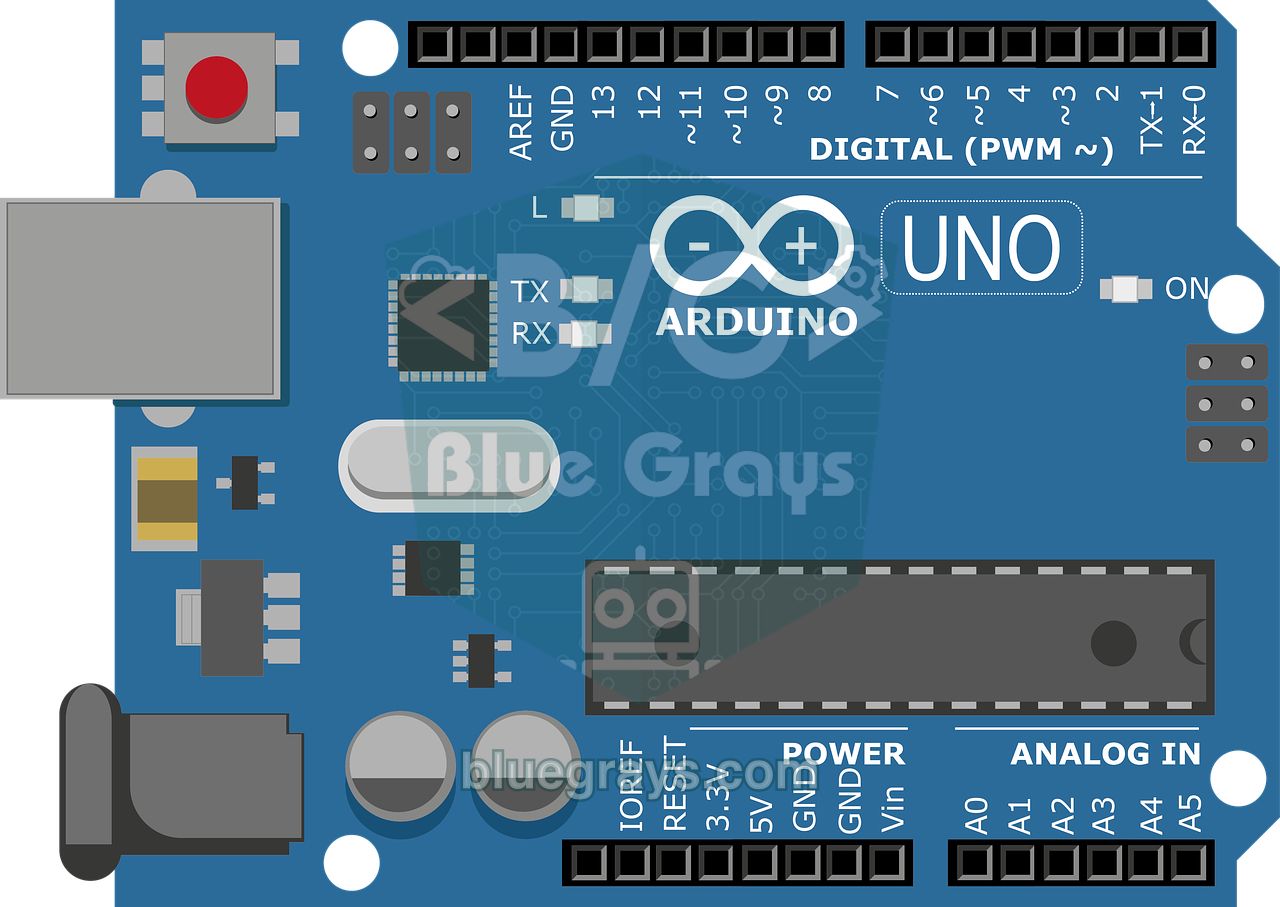
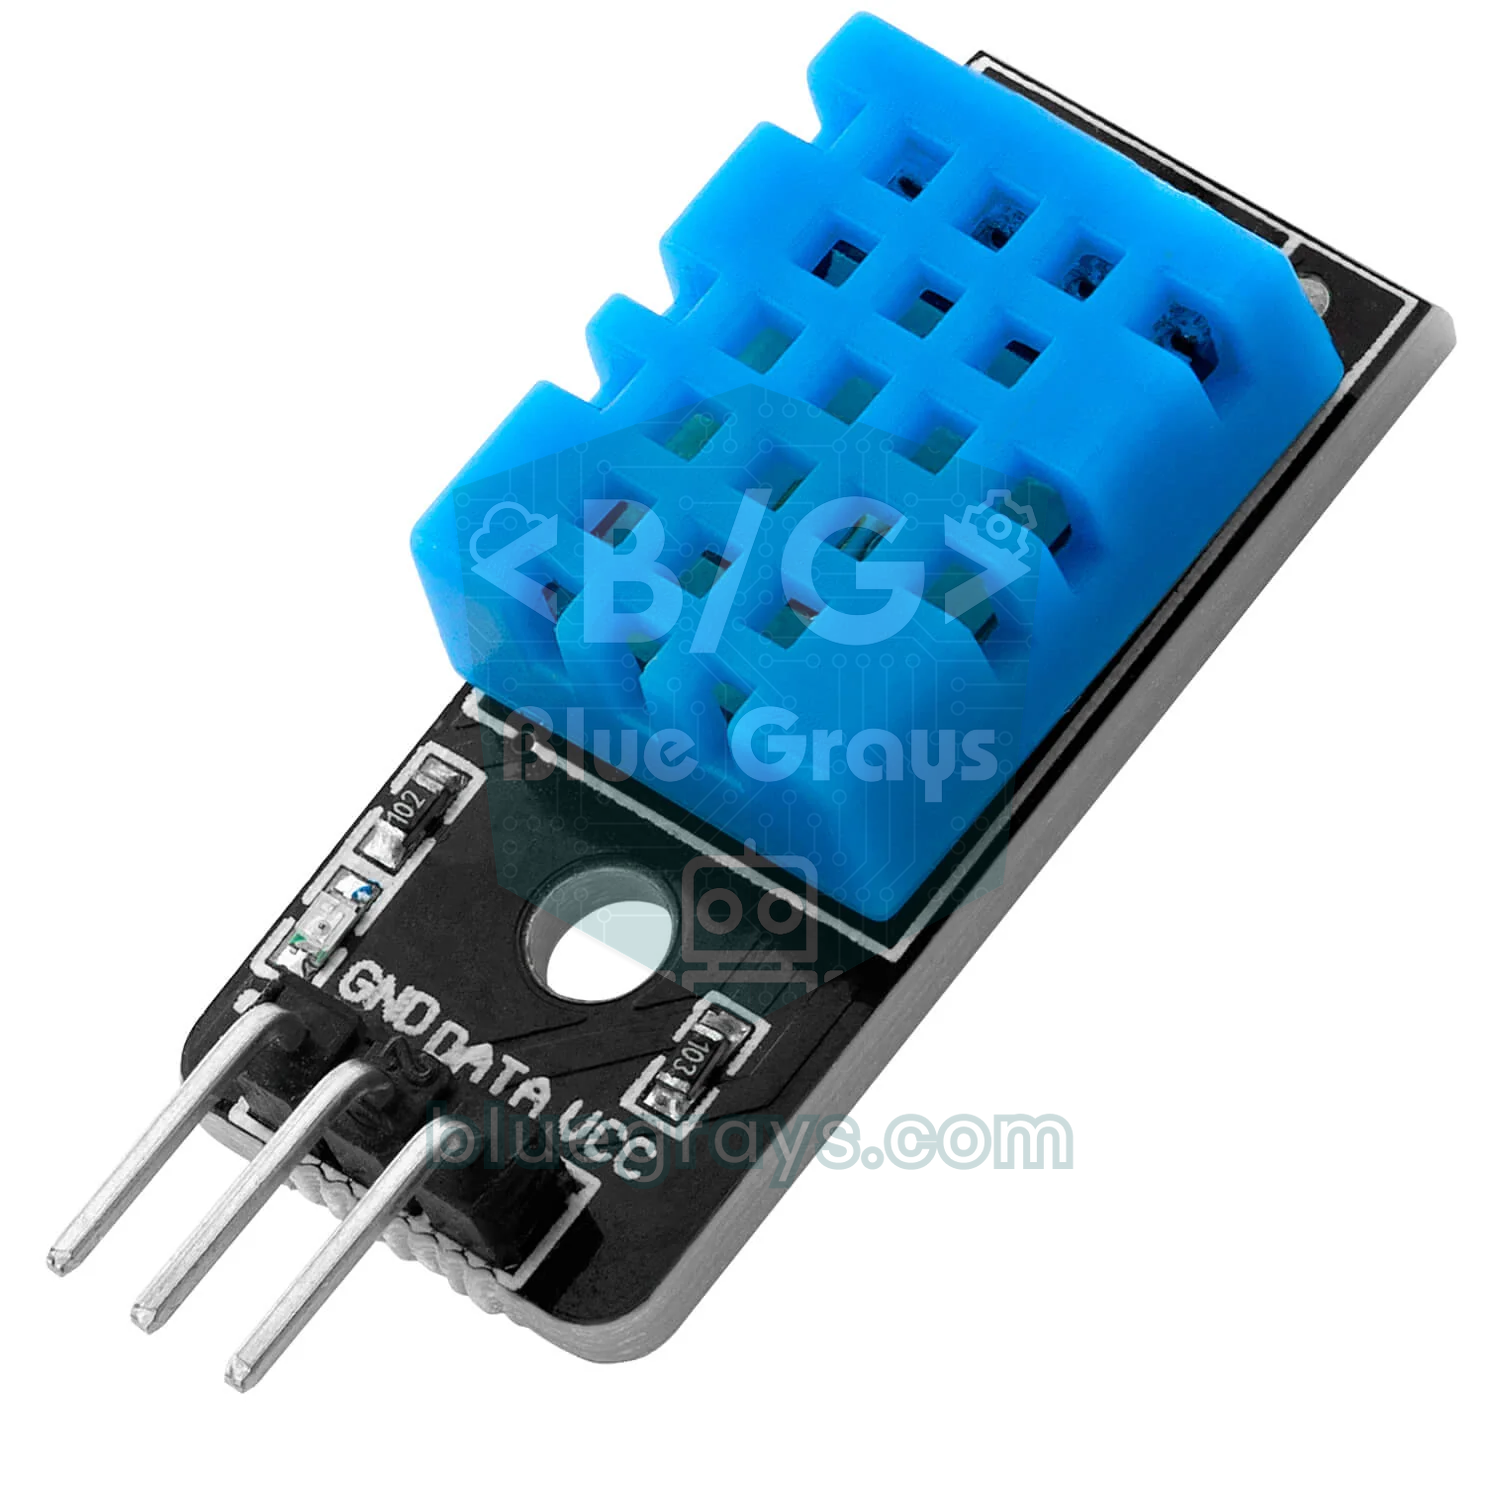
The example circuit has two sensors. The DHT11 measures temperature with 1 °C and humidity with 1% resolution; its accuracy is about ±2 °C and ±5% relative humidity, and it needs just one data pin. The LDR is a photoresistor whose resistance drops as light increases; you build a voltage divider with a 10 kΩ resistor and connect the midpoint to an analog pin. With the wiring below, the analog value rises as the light gets brighter. The number an LDR gives you isn't in lux but a relative light level, so it's honest to label it "light (%)" in your report. If you need real lux values, use a calibrated light sensor such as the BH1750.
| Connection | Arduino Uno | ESP32 | Raspberry Pi Pico |
|---|---|---|---|
| DHT11 VCC (+) | 5V | 3V3 | Built-in sensor used |
| DHT11 DATA (OUT) | D2 | GPIO 4 | Built-in sensor (ADC4) |
| DHT11 GND (-) | GND | GND | - |
| LDR leg 1 | 5V | 3V3 | 3V3(OUT), pin 36 |
| LDR leg 2 + 10 kΩ | A0 | GPIO 34 | GP26 (ADC0), pin 31 |
| Other end of the 10 kΩ | GND | GND | AGND, pin 33 |
Arduino code: sending readings as CSV lines
1// DHT11 + LDR ölçümlerini CSV satırı olarak gönderir / Sends DHT11 + LDR readings as CSV lines
2#include <DHT.h>
3
4const int DHT_PIN = 2;                 // DHT11 veri pini / DHT11 data pin
5const int LDR_PIN = A0;                // LDR + 10k gerilim bölücü / LDR + 10k voltage divider
6const unsigned long ARALIK = 2000;     // ölçüm aralığı, ms (DHT11 için en az 1000) / interval in ms (at least 1000 for DHT11)
7
8DHT dht(DHT_PIN, DHT11);               // DHT22 kullanıyorsan DHT22 yaz / write DHT22 if you use one
9unsigned long sonOlcum = 0;
10
11void setup() {
12  Serial.begin(9600);                  // Data Streamer ve PLX-DAQ varsayılanı / default of Data Streamer and PLX-DAQ
13  dht.begin();
14  Serial.println("zaman_s,sicaklik_C,nem_yuzde,isik_yuzde");   // başlık satırı / header row
15}
16
17void loop() {
18  if (millis() - sonOlcum < ARALIK) return;   // zamanı gelmediyse çık / not time yet
19  sonOlcum = millis();
20
21  float sicaklik = dht.readTemperature();     // santigrat derece / degrees Celsius
22  float nem = dht.readHumidity();             // bağıl nem, % / relative humidity, %
23  int isik = map(analogRead(LDR_PIN), 0, 1023, 0, 100);   // göreli ışık, % / relative light, %
24
25  if (isnan(sicaklik) || isnan(nem)) {
26    Serial.println("HATA,DHT okunamadi");     // sayı olmadığı için kolay ayıklanır / easy to filter out, not a number
27    return;
28  }
29
30  Serial.print(sonOlcum / 1000.0, 1);         // açılıştan beri geçen saniye / seconds since power-up
31  Serial.print(',');                          // sütun ayırıcı / column separator
32  Serial.print(sicaklik, 1);
33  Serial.print(',');
34  Serial.print(nem, 0);
35  Serial.print(',');
36  Serial.println(isik);                       // satır sonu = yeni Excel satırı / line end = new Excel row
37}
The sketch uses Adafruit's DHT sensor library; when you install it from the Library Manager, agree to install its dependency, Adafruit Unified Sensor, as well. Readings are taken every 2 seconds and timed with millis() instead of delay(), so loop() never blocks (details in the millis and delay guide). Each line contains the columns time, temperature, humidity and light in that order. Serial.print(sicaklik, 1) prints the number with one decimal place and always with a dot. If the sensor can't be read, the sketch prints "HATA" (error) instead of a number, so you can spot and filter out the bad row in the table right away. The header line in setup() is handy for the Serial Monitor and Python methods; you can delete it if you use Data Streamer. For slowly changing readings such as room temperature, set ARALIK (interval) to 60000 to take one reading per minute.
Method 1: saving the Serial Monitor output as CSV
- Upload the sketch, open Tools > Serial Monitor and choose 9600 baud from the speed menu.
- If you like, turn on timestamps: click the clock icon at the top right of the window in Arduino IDE 2, or the timestamp checkbox at the bottom in IDE 1.8. The computer's time is added to the start of every line in the form 14:03:21.512 ->.
- When the experiment is over, select the lines with the mouse and copy them with Ctrl+C (Cmd+C on macOS). If you want to keep the raw data, paste it into Notepad and save it as olcum.csv with the file type set to All Files.
- In Excel, click cell A1 of an empty sheet and paste with Ctrl+V; all the lines land in column A.
- With column A selected, open Data > Text to Columns, choose Delimited and tick Comma as the delimiter. If timestamps are on, tick Space too: the time goes into the first column and the "->" marks into the second, which you delete afterwards.
- On the last step, click Advanced and set the decimal separator to a dot; this makes sure values like 23.5 are recognised as numbers even if your Excel uses a comma for decimals. Click Finish and save the file as .xlsx.
This method is very practical for up to a few hundred lines; with thousands of lines, selecting becomes awkward and the IDE window slows down. For recordings that last hours, terminal programs such as PuTTY (Session > Logging > All session output) or CoolTerm, which runs on Windows, macOS and Linux (Connection > Capture to Text/Binary File), write every incoming line straight to a file. You bring that file into Excel with the same steps. Remember: while a terminal program or the Serial Monitor is using the port, the Excel add-ins and Python can't connect to it.
Method 2: live data with Excel Data Streamer
Data Streamer is a free add-in that Microsoft built for education; it streams CSV lines from the serial port straight into a worksheet. It comes with desktop Excel in Microsoft 365 (version 1902 and later), so you only have to enable it. Because it's a COM add-in, it works only on Windows; it isn't available in Excel for macOS or Excel in the browser. You don't need to change anything on the Arduino side: the sketch above works as it is at 9600 baud, the add-in's default speed.
- In Excel, open File > Options > Add-ins, choose COM Add-ins in the Manage list at the bottom and click Go.
- Tick Microsoft Data Streamer for Excel and click OK; the Data Streamer tab appears on the ribbon.
- Close the Serial Monitor in the Arduino IDE; a serial port can only be opened by one program at a time.
- Choose the Arduino's COM port with the Connect a Device button, then click Start Data. Depending on Excel's language, the button names may appear translated.
- Excel creates three sheets: Data In (incoming data), Data Out (data to send to the Arduino) and Settings. On the Settings sheet, set Data Channels to 4 and increase Data Rows to see more history in the table.
- To keep a permanent record, start recording with Record Data; when you stop it with Stop Recording, the readings are saved to a CSV file. You can replay that file later with Import Data File.
The top of the Data In sheet shows the latest values (Current Data), and below them is a table where past readings scroll by (Historical Data). If you select this table and add a line or scatter chart with Insert > Recommended Charts, the chart updates by itself with every new reading; it's ideal for showing a class how the light curve drops the instant you hold your hand over the sensor. On the Settings sheet, Data Interval (ms) sets how often the sheet refreshes, and Data Orientation decides whether the newest data appears at the top or the bottom of the table. Values you type into the Data Out sheet are sent to the Arduino as a CSV line too; the Arduino can read them with Serial.parseInt(), so you could, for example, set an alarm threshold from Excel.
Method 3: writing to Excel row by row with the PLX-DAQ macro
PLX-DAQ (Parallax Data Acquisition) is a VBA macro that runs inside Excel and turns special commands arriving on the serial port into Excel cells. Since Parallax's original version only works in 32-bit Excel, people today use PLX-DAQ v2, developed by the Arduino community; it supports 64-bit Excel and comes as a single .xlsm file. Because the macro relies on the Windows API, it also runs only on Windows. The difference from Data Streamer is that the Arduino is in charge of Excel: it writes the headers, clears the sheet and has Excel add the date and time.
1// PLX-DAQ v2: Excel'e tarih, saat ve ölçüm satırı yazar / PLX-DAQ v2: writes date, time and readings into Excel
2#include <DHT.h>
3
4DHT dht(2, DHT11);                     // DHT11 veri pini D2 / DHT11 data pin D2
5const int LDR_PIN = A0;
6
7void setup() {
8  Serial.begin(9600);                  // PLX-DAQ'ta da 9600 seç / choose 9600 in PLX-DAQ too
9  dht.begin();
10  Serial.println("CLEARDATA");         // eski ölçümleri sil / clear old readings
11  Serial.println("LABEL,Tarih,Saat,Sure (s),Sicaklik (C),Nem (%),Isik (%)");   // 1. satır başlıkları / row 1 headers
12  Serial.println("RESETTIMER");        // TIMER sayacını sıfırla / reset the TIMER counter
13}
14
15void loop() {
16  float sicaklik = dht.readTemperature();
17  float nem = dht.readHumidity();
18  int isik = map(analogRead(LDR_PIN), 0, 1023, 0, 100);
19
20  if (!isnan(sicaklik) && !isnan(nem)) {
21    Serial.print("DATA,DATE,TIME,TIMER,");   // DATE, TIME, TIMER'ı Excel doldurur / Excel fills in DATE, TIME, TIMER
22    Serial.print(sicaklik, 1);
23    Serial.print(',');
24    Serial.print(nem, 0);
25    Serial.print(',');
26    Serial.println(isik);
27  }
28  delay(2000);                         // DHT11 saniyede en fazla 1 ölçüm verir / DHT11 gives at most 1 reading per second
29}| Command | What it does |
|---|---|
| CLEARDATA | Deletes the old readings on the sheet |
| LABEL,Tarih,Saat,... | Writes the column headers into row 1 |
| DATA,... | Writes a new reading into the next empty row |
| DATE and TIME | Replaced with the computer's date and time in a DATA line |
| TIMER | Seconds since logging started or since RESETTIMER |
| RESETTIMER | Resets the TIMER counter |
| ROW,SET,2 | Sets the row the next data will be written to |
| CELL,SET,G2,25 / CELL,GET,G2 | Writes a value into a cell, or sends a cell's value back to the Arduino |
| SAVEWORKBOOK | Saves the Excel file |
- Download the PLX-DAQ v2 file and extract it from the zip. Right-click the .xlsm file and tick Unblock under Properties; Office blocks macros in files from the internet by default.
- Open the file and click Enable Content in the yellow bar at the top.
- Close the Serial Monitor in the Arduino IDE and click the Open PLX DAQ UI button on the sheet.
- In the window that opens, type only the COM number in the Port box (5 for COM5), choose 9600 as the Baud rate and click Connect.
- If no headers show up, press the Arduino's reset button: setup() runs again, the CLEARDATA and LABEL commands reach Excel and the rows start flowing in.
- When you've finished, click Disconnect and, if you like, save the data as a separate .xlsx file.
Method 4: automatic CSV and Excel files with Python
If you're on a Mac or Linux, plan to log for hours, or are tired of building the report by hand every time, Python is the most flexible option. First install the two packages in a terminal with python -m pip install pyserial openpyxl. The first script below listens to the Arduino and writes every reading, together with the computer's time, to the file deney_olcumleri.csv. We covered topics such as finding the port, the automatic reset and live plotting in detail in the Arduino Python serial communication guide.
1import csv
2import time
3from datetime import datetime
4
5import serial
6
7PORT = "COM3"               # macOS: /dev/cu.usbmodem…, Linux: /dev/ttyACM0
8BAUD = 9600                 # Arduino'daki Serial.begin ile aynı / same as Serial.begin on the Arduino
9DOSYA = "deney_olcumleri.csv"
10AYIRICI = ";"               # Türkçe Excel ; bekler, İngilizce Excel , / Turkish Excel expects ;, English Excel ,
11ONDALIK = ","               # Türkçe Excel ondalık virgül, İngilizce nokta / decimal comma in Turkish Excel, dot in English
12
13
14def sayi(x):
15    return f"{x:.1f}".replace(".", ONDALIK)   # 23.5 -> "23,5"
16
17
18with serial.Serial(PORT, BAUD, timeout=3) as ser, \
19        open(DOSYA, "w", newline="", encoding="utf-8-sig") as f:   # BOM: Excel Türkçe harfleri doğru gösterir / BOM keeps accents readable
20    time.sleep(2)                       # Uno port açılınca resetlenir / the Uno resets when the port opens
21    ser.reset_input_buffer()            # yarım kalmış satırları at / drop partial lines
22    yazici = csv.writer(f, delimiter=AYIRICI)
23    yazici.writerow(["Zaman", "Süre (s)", "Sıcaklık (°C)", "Nem (%)", "Işık (%)"])
24    print("Kayıt başladı, durdurmak için Ctrl+C / logging, press Ctrl+C to stop")
25    try:
26        while True:
27            satir = ser.readline().decode("utf-8", errors="ignore").strip()
28            parca = satir.split(",")
29            if len(parca) != 4:
30                continue                # boş, hata ya da başlık satırı / empty, error or header line
31            try:
32                sure, sicaklik, nem, isik = (float(p) for p in parca)
33            except ValueError:
34                continue                # sayı olmayan satır / non-numeric line
35            simdi = datetime.now()
36            yazici.writerow([simdi.strftime("%Y-%m-%d %H:%M:%S"),   # bilgisayar saati / PC clock
37                             sayi(sure), sayi(sicaklik), sayi(nem), sayi(isik)])   # süre Arduino'dan gelir / elapsed time comes from the Arduino
38            f.flush()                   # satırı hemen diske yaz / write the row to disk now
39            print(simdi.strftime("%H:%M:%S"), sicaklik, nem, isik)
40    except KeyboardInterrupt:
41        print("Kayıt bitti / logging stopped:", DOSYA)
Three details in the script keep it compatible with Excel. The utf-8-sig encoding adds an invisible BOM at the start of the file; without it, Excel shows characters such as "°C" or accented letters garbled. The AYIRICI (separator) and ONDALIK (decimal) constants are set to a semicolon and a decimal comma, the format Excel expects with most continental European regional settings; with US or UK settings, just change them to a comma and a dot. f.flush() writes each row to disk immediately, so if the computer shuts down or the cable comes loose you lose at most the last reading. After you stop the script with Ctrl+C, simply double-click the file and the columns open correctly separated. If you want to look at the file while logging is still running, open a copy, because Excel can lock the files it opens.
1import csv
2from datetime import datetime
3
4from openpyxl import Workbook
5from openpyxl.chart import Reference, ScatterChart, Series
6
7GIRIS = "deney_olcumleri.csv"
8CIKIS = "deney_raporu.xlsx"
9
10wb = Workbook()
11ws = wb.active
12ws.title = "Olcumler"
13
14with open(GIRIS, encoding="utf-8-sig", newline="") as f:
15    okuyucu = csv.reader(f, delimiter=";")
16    ws.append(next(okuyucu))                               # başlık satırı / header row
17    for satir in okuyucu:
18        zaman = datetime.strptime(satir[0], "%Y-%m-%d %H:%M:%S")
19        degerler = [float(x.replace(",", ".")) for x in satir[1:]]   # "23,5" -> 23.5
20        ws.append([zaman] + degerler)                      # .xlsx sayıyı sayı olarak saklar / .xlsx stores real numbers
21
22son = ws.max_row
23for hucre in ws["A"][1:]:
24    hucre.number_format = "hh:mm:ss"                       # zaman sütunu biçimi / time column format
25ws.column_dimensions["A"].width = 12
26
27# Özet tablo: formüller İngilizce yazılır, Excel kendi diline çevirir
28# Summary: formulas are written in English, Excel shows them in its own language
29ws["G1"], ws["H1"], ws["I1"], ws["J1"] = "Özet", "Sıcaklık (°C)", "Nem (%)", "Işık (%)"
30for i, (ad, fonk) in enumerate([("Ortalama", "AVERAGE"), ("En düşük", "MIN"),
31                                ("En yüksek", "MAX"), ("Std. sapma", "STDEV")], start=2):
32    ws.cell(row=i, column=7, value=ad)
33    for sutun, harf in ((8, "C"), (9, "D"), (10, "E")):
34        ws.cell(row=i, column=sutun, value=f"={fonk}({harf}2:{harf}{son})")
35
36# Her ölçüm için süre-değer (XY dağılım) grafiği / one time-value (XY scatter) chart per reading
37x = Reference(ws, min_col=2, min_row=2, max_row=son)       # Süre (s) sütunu / elapsed time column
38for sutun, baslik, konum in ((3, "Sıcaklık (°C)", "G8"), (5, "Işık (%)", "G24")):
39    grafik = ScatterChart()
40    grafik.title = baslik + " - süre"
41    grafik.x_axis.title = "Süre (s)"
42    grafik.y_axis.title = baslik
43    grafik.x_axis.delete = False                           # yeni Excel'de eksenler görünsün / keep axes visible
44    grafik.y_axis.delete = False
45    y = Reference(ws, min_col=sutun, min_row=1, max_row=son)
46    grafik.series.append(Series(y, x, title_from_data=True))
47    grafik.width, grafik.height = 18, 8                    # cm
48    ws.add_chart(grafik, konum)
49
50wb.save(CIKIS)
51print(son - 1, "ölçüm yazıldı / readings written:", CIKIS)
The second script converts the CSV into a real .xlsx file. Inside an .xlsx, numbers are stored as numbers rather than text, so the separator and decimal problem disappears completely; the file opens the same way in English, German or Turkish Excel. The script also adds a summary table with the mean, minimum, maximum and standard deviation, plus two scatter charts for temperature and light. The formulas are written into the file with their English names (AVERAGE, MIN, MAX, STDEV), and Excel translates them into its own language when it opens the file. The delete = False lines prevent a problem where axis labels don't show up in charts created with recent versions of openpyxl.
Adding timestamps: millis(), the computer clock or an RTC
| Source | How to get it | Pros | Cons |
|---|---|---|---|
| millis() | millis() / 1000.0 in the Arduino sketch | No extra hardware, millisecond resolution | Resets with every reset, isn't a real date, overflows after 49.7 days |
| Computer clock | Python datetime, PLX-DAQ DATE and TIME, Serial Monitor timestamps | Real date and time, no setup needed | The computer must stay connected |
| RTC module (DS3231, DS1307) | rtc.now() with RTClib | Works without a computer, a battery keeps the clock running | Needs an extra module; a DS1307 can drift a few seconds a day |
| Internet time (NTP) | configTime() on the ESP32 | Accurate time to the second with no setting | Needs a Wi-Fi connection |
For experiments connected to a computer, the computer clock is the easiest choice, and our Python script writes it on every row. Keeping the elapsed time sent by the Arduino as well is a good habit: it shows the real interval between readings, and you notice immediately if a row goes missing. If you send the raw millis() value from the Arduino, you can convert it to seconds in Excel with =B2/1000, or to minutes with =B2/60000. If the Arduino is going to work independently of a computer, for example logging to an SD card, you should take the date and time from an RTC clock module; the details of logging CSV to an SD card are in the SD card module guide. With an ESP32 you can also fetch the time from the internet: NTP time with the ESP32.
Creating a chart in Excel
- Select the time and temperature columns together with their headers; if the columns aren't next to each other, hold down Ctrl while selecting the second one.
- Choose a scatter type with lines from Insert > Charts > Scatter (X, Y).
- Use the + button next to the chart to turn on Axis Titles, and name the axes with their units: "Time (s)" and "Temperature (°C)".
- To add the light series, right-click the chart and add the light column with Select Data > Add; because the scales are very different, right-click the series and choose Format Data Series > Secondary Axis.
- Right-click the vertical axis and fix the minimum and maximum values under Format Axis, so a 1 °C change doesn't look like a huge swing.
Why a scatter chart instead of a line chart? Excel's Line chart treats the values on the horizontal axis as evenly spaced labels; if a reading is missing or you change the interval, the time axis is silently distorted. A Scatter (X, Y) chart places every point at its real time, which is what a scientific graph is expected to do. If you're only comparing a few fixed values, such as the average temperature in three different rooms, a column chart is easier to read. If the sensor is noisy, right-click the series and smooth the curve with Add Trendline > Moving Average.
Lab report example: a measurement table
Let's say the question of your experiment is: "How do the temperature, humidity and light level of the air near a desk lamp change when the lamp is switched on?" We placed the sensors about 15 cm from the lamp and set ARALIK in the sketch to 60000, which means one reading per minute. We switched the lamp on at minute 1 and off at minute 6. The values below are typical example values you could get with this setup; the last two rows are summaries calculated with Excel formulas:
| Time (min) | Temperature (°C) | Humidity (%) | Light (%) | Status |
|---|---|---|---|---|
| 0 | 23 | 46 | 14 | Lamp off |
| 1 | 23 | 46 | 81 | Lamp switched on |
| 2 | 24 | 45 | 82 | Lamp on |
| 3 | 25 | 44 | 82 | Lamp on |
| 4 | 26 | 43 | 83 | Lamp on |
| 5 | 26 | 42 | 83 | Lamp on |
| 6 | 26 | 42 | 15 | Lamp switched off |
| 7 | 25 | 43 | 14 | Lamp off |
| 8 | 24 | 45 | 14 | Lamp off |
| Mean | 24.7 | 44.0 | 52.0 | - |
| Minimum / maximum | 23 / 26 | 42 / 46 | 14 / 83 | - |
You calculate the summary rows in Excel with =AVERAGE(B2:B10), =MIN(B2:B10) and =MAX(B2:B10); to show how spread out the readings are, you can add =STDEV(B2:B10) as well. When you interpret the results, describe the pattern in the table: the light jumped from 14% to 81% the moment the lamp came on, while the temperature rose slowly by 3 °C over about 3 minutes; this is called thermal inertia. When the lamp went off, the light dropped at once, but the temperature stayed high for a few more minutes. Relative humidity fell as the temperature rose, because warmer air can hold more moisture even if the amount of water in it stays the same. An incandescent or halogen lamp shows this effect clearly; with an LED lamp the temperature rise is much smaller.
- Aim: your research question and hypothesis in one sentence.
- Materials: the board model, sensors, resistors and the software you used (Arduino IDE, Excel).
- Method: where the sensors were placed, the measurement interval (for example 60 s), how long the experiment lasted and which method you used to get the data into Excel.
- Data table: every column header should include its unit; use the summary table in the text and attach the full raw data as an appendix.
- Graph: a scatter chart with axis titles, units and the events marked (lamp switched on, switched off).
- Conclusion and sources of error: compare your findings with the hypothesis and list limitations such as the DHT11's ±2 °C accuracy, the uncalibrated LDR and the sensor's distance from the lamp.
Sending ESP32 data to Excel
All the methods work the same way on the ESP32; for Data Streamer and PLX-DAQ the ESP32 is just another serial port. Three things change: analog readings are 12-bit (0–4095), the LDR divider is powered from 3.3 V, and you should pick one of the ADC1 pins (GPIO 32–39) as the analog input, because they keep working while Wi-Fi is on. ESP32 boards are usually used at 115200 baud, so change the speed in the Python script, in Data Streamer and in PLX-DAQ accordingly. The bootloader messages that appear on the serial port at startup aren't numbers, so the Python script skips them anyway. If you'd like to send the readings to the cloud without connecting to a computer at all, take a look at the ESP32 data logging to Google Sheets guide.
1// ESP32: aynı CSV çıktısı, 12 bit ADC ve 3,3 V / ESP32: same CSV output, 12-bit ADC and 3.3 V
2#include <DHT.h>
3
4const int DHT_PIN = 4;                 // güvenli bir GPIO / a safe GPIO
5const int LDR_PIN = 34;                // ADC1 pini, Wi-Fi açıkken de okur / ADC1 pin, still reads with Wi-Fi on
6DHT dht(DHT_PIN, DHT11);
7
8void setup() {
9  Serial.begin(115200);                // Python'da ve Data Streamer'da da 115200 / 115200 in Python and Data Streamer too
10  dht.begin();
11  analogReadResolution(12);            // 0-4095
12}
13
14void loop() {
15  float sicaklik = dht.readTemperature();
16  float nem = dht.readHumidity();
17  int isik = map(analogRead(LDR_PIN), 0, 4095, 0, 100);   // göreli ışık, % / relative light, %
18
19  if (!isnan(sicaklik) && !isnan(nem)) {
20    // zaman_s,sicaklik,nem,isik biçimi, Uno koduyla aynı / same zaman_s,temp,hum,light format as the Uno sketch
21    Serial.printf("%.1f,%.1f,%.0f,%d\n", millis() / 1000.0, sicaklik, nem, isik);
22  }
23  delay(2000);
24}
Logging CSV with a Raspberry Pi Pico (MicroPython)
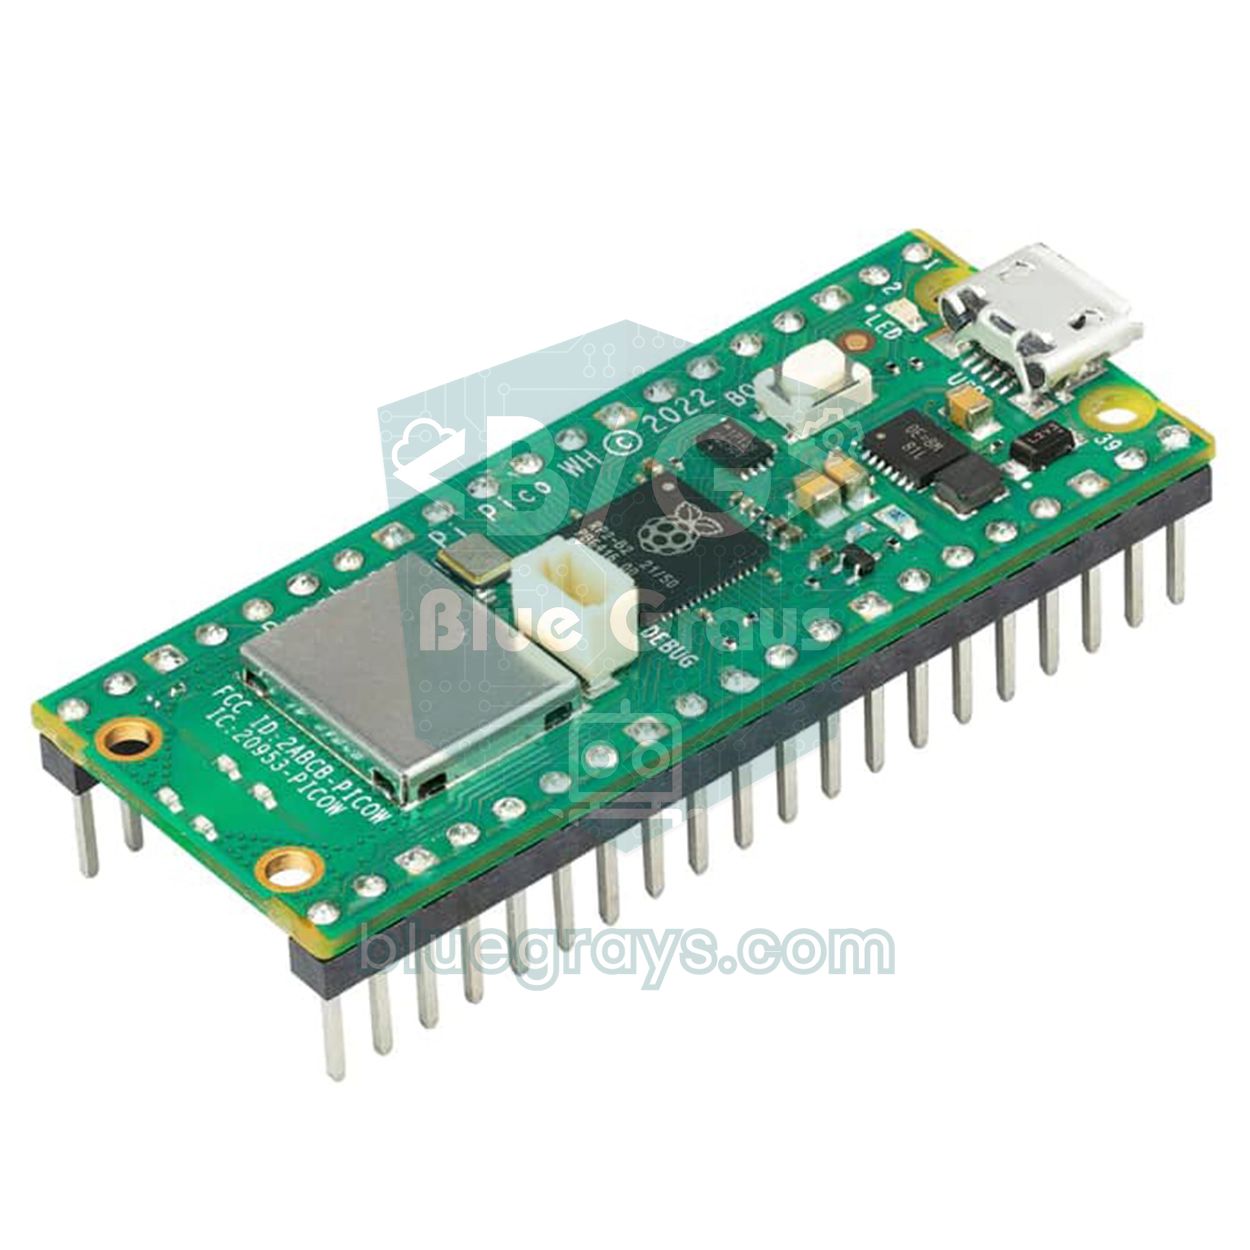
If you use MicroPython on a Raspberry Pi Pico, you can write the readings to a CSV file in the board's own flash memory instead of sending them to a computer; that way you don't need a computer at all and can leave the Pico, powered by a power bank, wherever you want to measure. The code below uses the built-in temperature sensor (ADC4), which needs no extra hardware, and an LDR connected to GP26, and it writes the file with semicolons and decimal commas so it suits European-locale Excel. Because the built-in sensor measures the chip's temperature, it can read a few degrees above the room temperature; use an external sensor for accurate measurements. If you're new to MicroPython, start with the What is the Raspberry Pi Pico guide.
1import os
2import time
3
4import machine
5
6ldr = machine.ADC(26)                 # GP26 = ADC0, LDR + 10k bölücü / LDR + 10k divider
7ic_sensor = machine.ADC(4)            # yongadaki sıcaklık sensörü / on-chip temperature sensor
8DOSYA = "olcum.csv"
9ARALIK_S = 10                         # ölçüm aralığı, saniye / interval in seconds
10
11
12def tr(x):
13    return "{:.1f}".format(x).replace(".", ",")   # Türkçe Excel için ondalık virgül / decimal comma for Turkish Excel
14
15
16try:
17    os.stat(DOSYA)                    # dosya varsa silme, sonuna ekle / keep an existing file, append to it
18except OSError:
19    with open(DOSYA, "w") as f:
20        f.write("Sure (s);Sicaklik (C);Isik (%)\n")   # ASCII başlık / ASCII header
21
22baslangic = time.ticks_ms()
23while True:
24    volt = ic_sensor.read_u16() * 3.3 / 65535
25    sicaklik = 27 - (volt - 0.706) / 0.001721       # RP2040 veri sayfası formülü / RP2040 datasheet formula
26    isik = ldr.read_u16() * 100 / 65535             # göreli ışık, % / relative light, %
27    sure = time.ticks_diff(time.ticks_ms(), baslangic) / 1000
28    satir = "{};{};{}".format(tr(sure), tr(sicaklik), tr(isik))
29    print(satir)                                    # Thonny kabuğunda da görünür / also shown in the Thonny shell
30    with open(DOSYA, "a") as f:                     # her satırda aç-kapat / open and close for every line
31        f.write(satir + "\n")                       # elektrik kesilse de veri kalır / data survives a power cut
32    time.sleep(ARALIK_S)
If you save the code to the Pico in Thonny as main.py, the board starts logging by itself every time it powers up; if the file already exists it isn't deleted, and new lines are appended to the end. When the measurement is over, connect the Pico to your computer, click Stop in Thonny, right-click olcum.csv in the View > Files panel, download it to your computer and open it in Excel. With one line of about 20 bytes every 10 seconds, the file grows by roughly 170 KB a day; on the Pico's file system that leaves plenty of room for several days of logging. If your Excel uses a dot for decimals, remove the replace() call in the tr() function.
Common errors and how to fix them
| Symptom | Cause | Fix |
|---|---|---|
| The port won't open, "Access is denied" | The Serial Monitor, Serial Plotter or another program is using the port | Close every window that uses the port; it can only be opened by one program at a time |
| All values end up in one column | The CSV separator doesn't match Excel's regional settings | Split at the commas with Data > Text to Columns, or set the separator to ; in Python |
| 23.5 became a date (23 May) or stayed as text | Excel with a European regional format expects a decimal comma | Set the decimal separator to a dot under Text to Columns > Advanced, or untick Use system separators under File > Options > Advanced |
| Accented letters and the ° sign are garbled | The CSV was saved as UTF-8 without a BOM | Use encoding="utf-8-sig" in Python, or avoid special characters in headers |
| Garbage characters fill the table | The baud rate doesn't match | Make the speed in Serial.begin() match Data Streamer, PLX-DAQ or Python |
| There's no Data Streamer tab | The add-in isn't enabled or your Excel version doesn't support it | Enable it under COM Add-ins; the add-in doesn't exist in Excel for macOS or on the web |
| The PLX-DAQ buttons don't work | Macros are blocked | Tick Unblock in the file's Properties, then click Enable Content |
| PLX-DAQ can't connect to the port | Wrong or very high COM number | In Device Manager, change the COM number to a low value (for example COM4) under the port's Port Settings > Advanced |
| HATA or nan instead of temperature and humidity | DHT11 wiring, a missing pull-up or reading too often | Check the wires and wait at least 1 second between two readings |
Project ideas with Excel data logging
- Cooling curve: measure how a glass of hot water cools with a waterproof DS18B20, add an exponential trendline in Excel and explore Newton's law of cooling.
- Mini weather station: log temperature, humidity and pressure with a BME280 for a week and chart the difference between night and day.
- Plant watering log: record the soil moisture sensor value before and after watering and find out how long the soil takes to dry out.
- Motion analysis: build a distance-time table with an HC-SR04 and calculate speed and acceleration in Excel from the differences between consecutive rows.
- Battery discharge curve: measure a battery's voltage with a voltage divider, log it for hours and study how the voltage falls over time.
- Science fair project: compare how much boxes of different colours heat up in the sun; for more ideas see the Arduino science fair project ideas guide.
Whichever method you choose, the basics are the same: produce clean, consistent CSV lines on the Arduino and bring them into Excel with the right separator on the computer. The Serial Monitor is best for a quick check, Data Streamer for a live classroom demo, PLX-DAQ for controlling Excel from the Arduino and Python for long, automatic logging. In the BlueGrays app you'll find projects such as temperature and humidity measurement with a DHT11, light intensity reading with an LDR and an ESP32 temperature logger, step by step with circuit diagrams and code, and you can send the data you measure to Excel with these methods.
Frequently asked questions
How do I get Arduino data into Excel?
The easiest way is to send the readings from the Arduino as comma-separated lines with Serial.println() and bring those lines into Excel. On Windows with Microsoft 365, the Data Streamer add-in transfers the data live, and the PLX-DAQ macro does a similar job. On a Mac or Linux, logging to a CSV file with Python and pyserial is the most practical solution.
Does Excel Data Streamer work on a Mac?
No. Data Streamer is a COM add-in and is only available in Microsoft 365 desktop Excel on Windows; it isn't part of Excel for macOS or the web version. On a Mac you can create a CSV or .xlsx file with Python, or save the serial output to a file with a terminal program such as CoolTerm.
Does PLX-DAQ work with 64-bit Excel?
Parallax's original PLX-DAQ only works in 32-bit Excel. PLX-DAQ v2, developed by the Arduino community, also supports 64-bit Excel and uses the same CLEARDATA, LABEL and DATA commands. Both versions are VBA macros, so they only run on Windows and need macros to be enabled.
How do I save data from the Arduino Serial Monitor?
The Serial Monitor has no save button; you select the lines with the mouse, copy them with Ctrl+C and paste them into a text file or straight into Excel. If you turn on the timestamp option, the computer's time is added to every line. For long recordings it's safer to use the file logging feature of PuTTY or CoolTerm, or a Python script.
Why does my CSV file open in a single column in Excel?
With many European regional settings, Excel expects a semicolon as the column separator, so when you double-click a comma-separated file, all the values stay in column A. You can split the data at the commas with Data > Text to Columns, or import the file with Data > From Text/CSV and choose the delimiter yourself. If you generate the file with Python, using the separator your Excel expects from the start is the most lasting fix.
How can I log Arduino data without a computer?
Without a computer, you can write the readings to an SD card module as a CSV file and take the date and time from an RTC module; later you put the card into a computer and open the file in Excel. With a Wi-Fi-enabled ESP32 you can send the data straight to Google Sheets. A Raspberry Pi Pico can write a CSV file to its own flash memory with MicroPython.
Projects to build after reading this
See all projects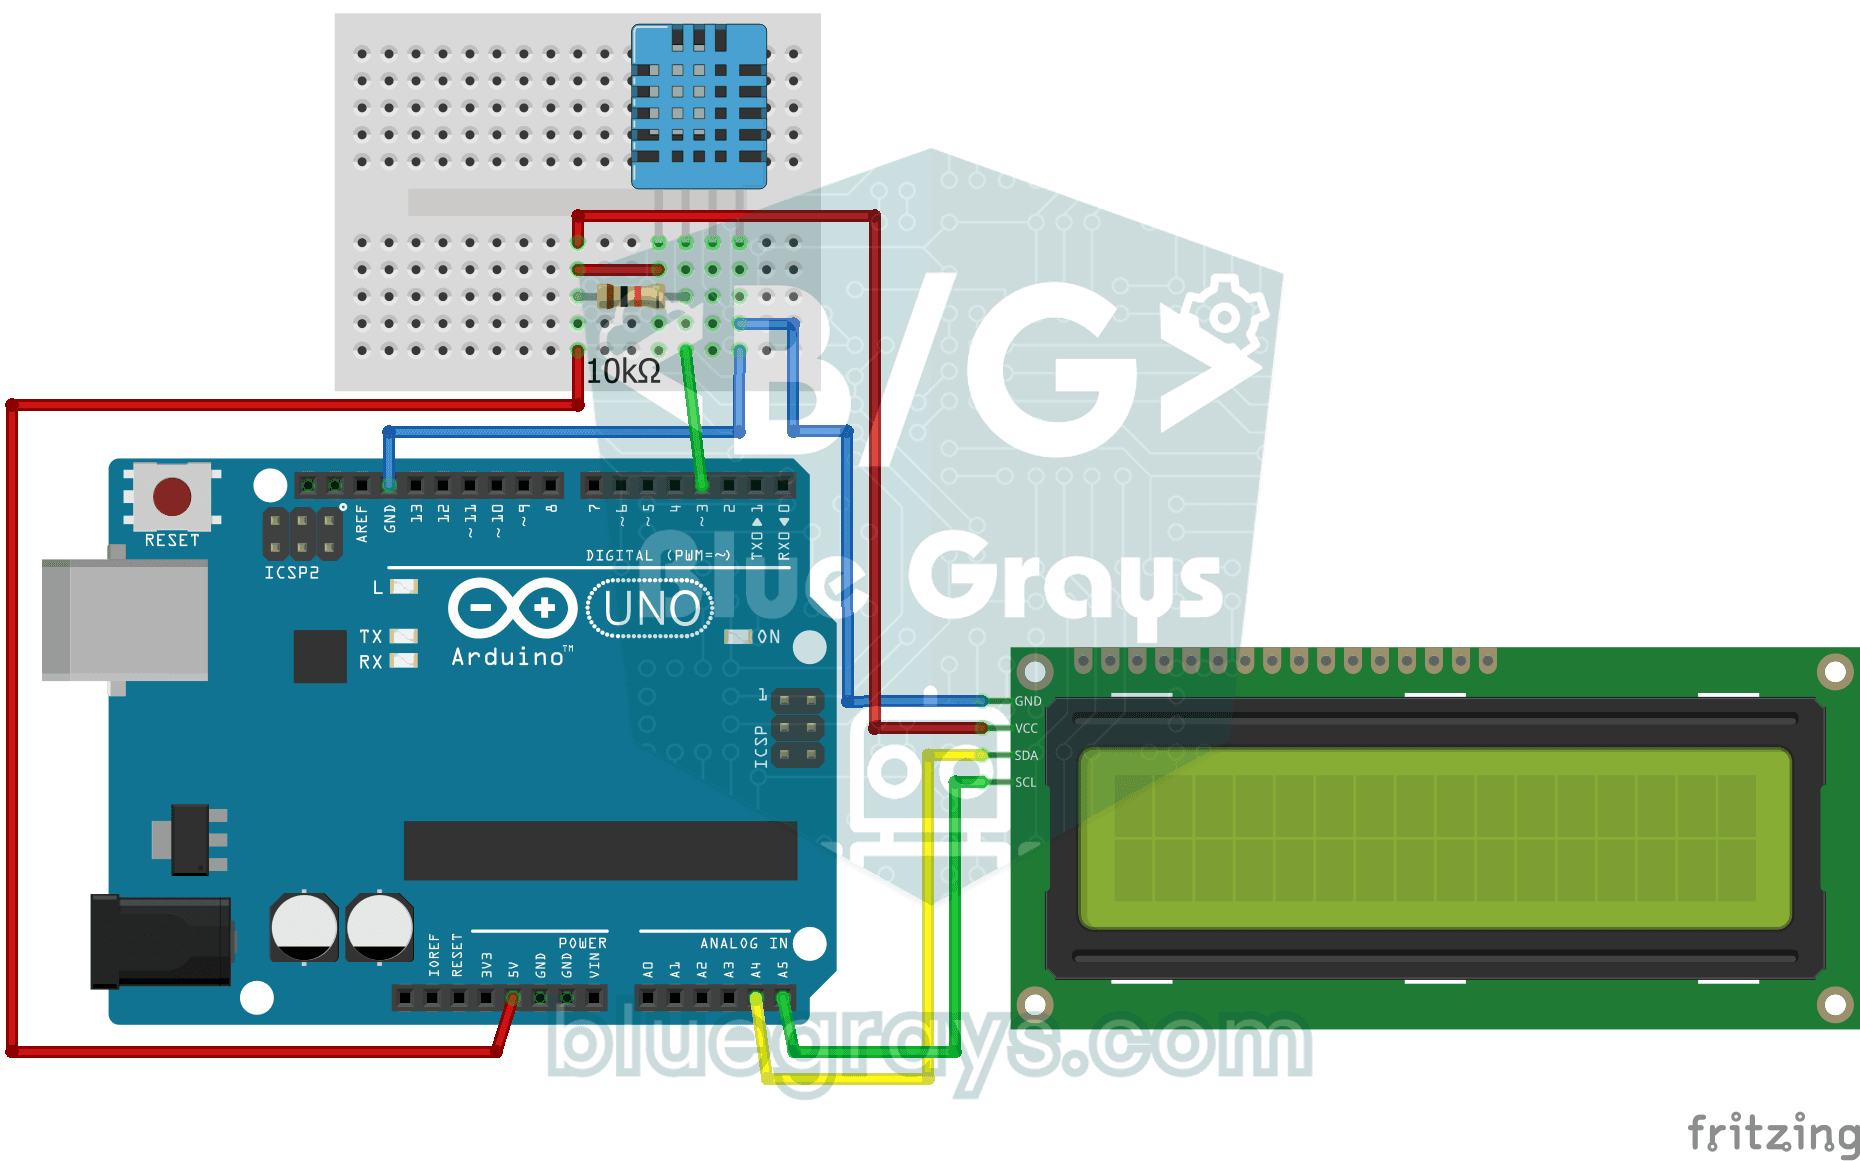
Temperature and Humidity with DHT11
How warm is your room, and is the air humid or dry? The DHT11 sensor measures temperature and humidity, and the Arduino writes the values on a two-line LCD screen, refreshing every couple of seconds.

Measuring Light Intensity with an LDR
Want to see how bright your room is as a number? The LDR, a small part that reacts to light, measures the light around it, and the Arduino writes the value to your computer screen every half second. C
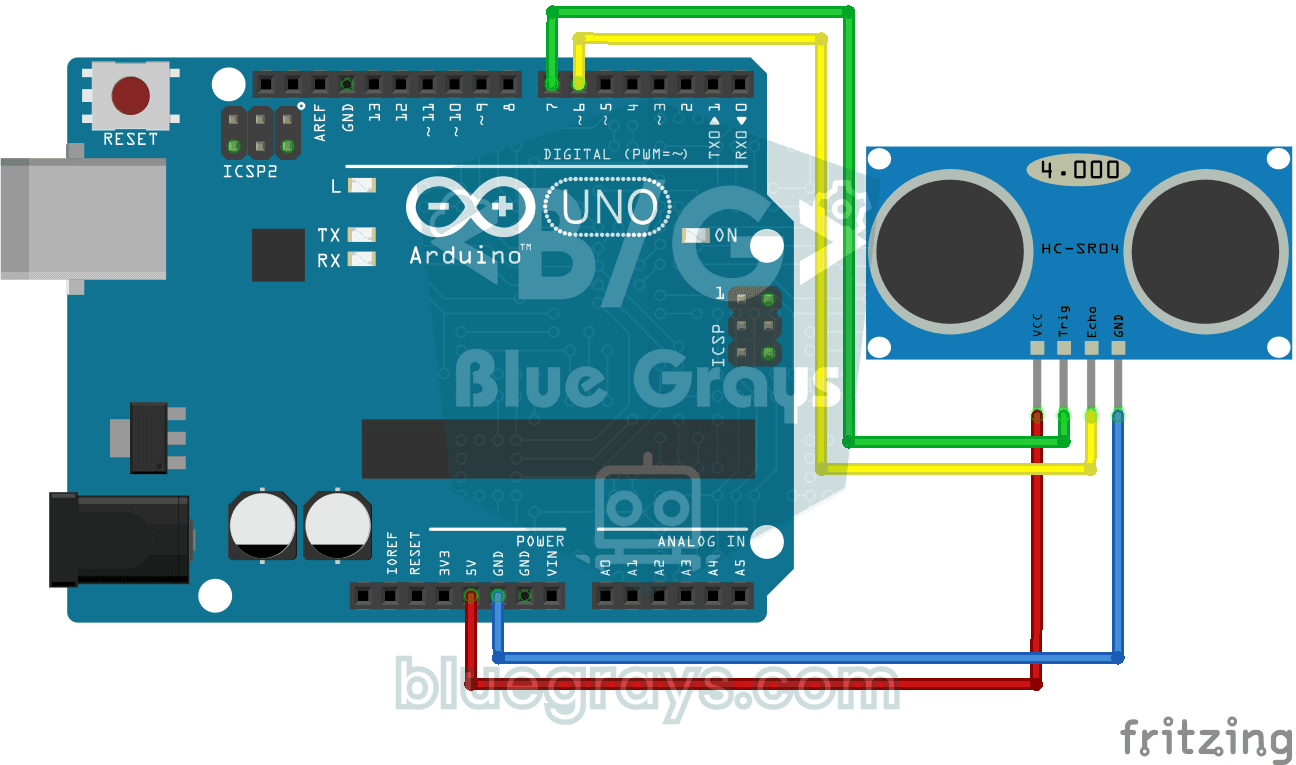
HC-SR04 Distance Measurement (Serial Display)
The HC-SR04 sensor works just like a bat finding its way in the dark: it sends out a sound you cannot hear, listens for the echo and measures how far away the object in front of it is. The Arduino wri

Reading Light Intensity with the ESP32 LDR Module
Real-time monitoring of the LDR module's raw ADC value and relative light percentage calculated from dark and light reference values in the Serial Monitor. This percentage is not a lux measurement. Teaches the module’s calibration logic. It is ideal to complete this before Project 10, as it is used to determine the threshold value.
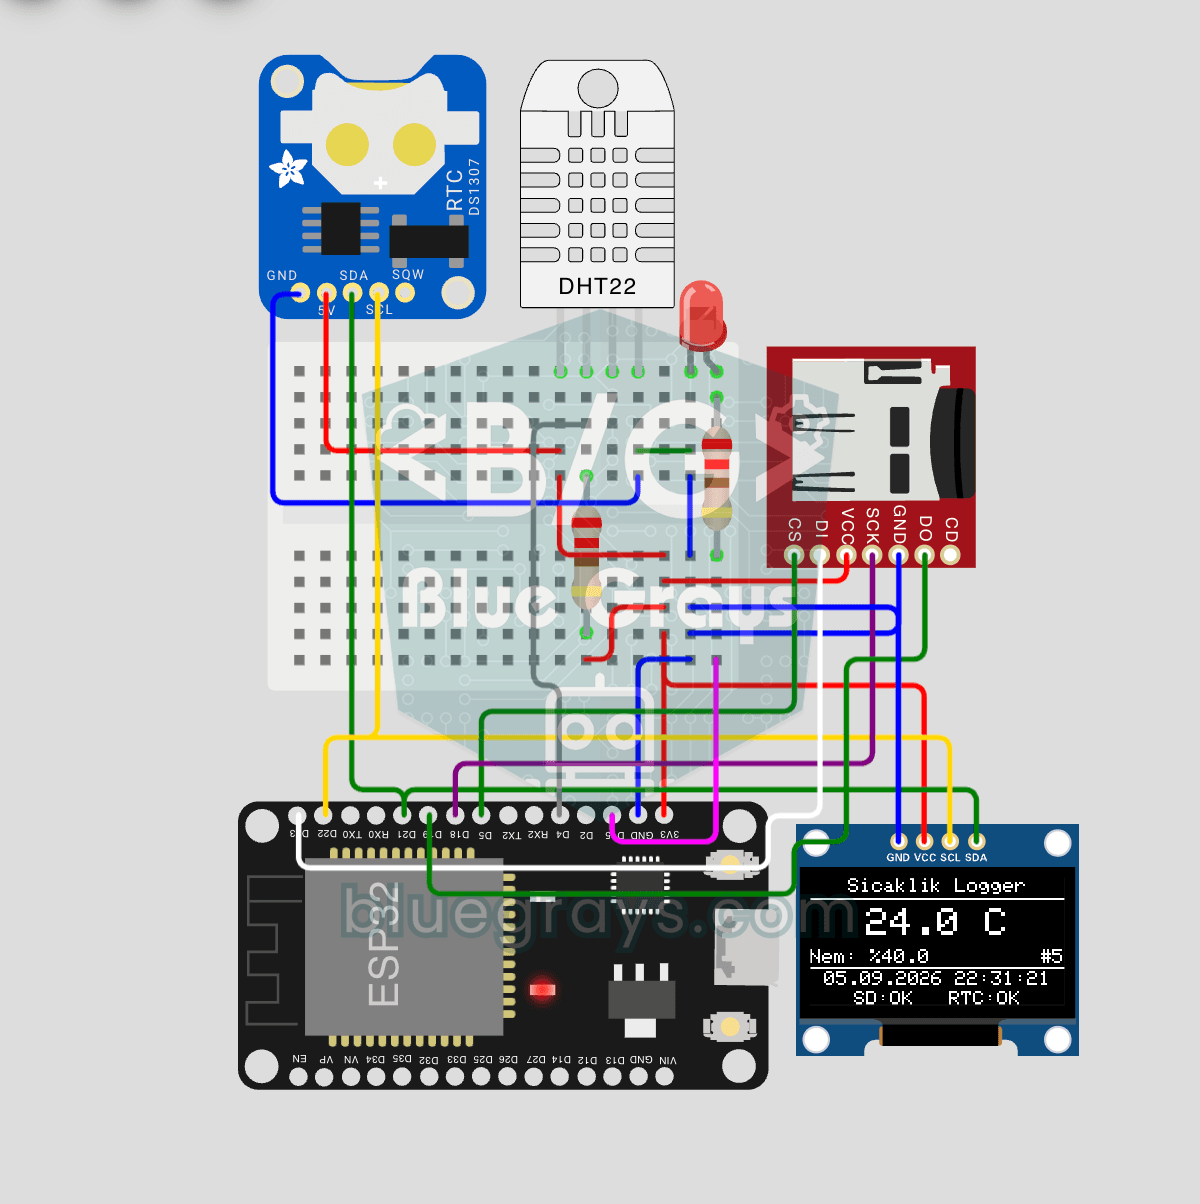
ESP32 Temperature Data Logger (DHT22 + DS1307 RTC + microSD + OLED)
Build a timestamped temperature logger with ESP32! Read DHT22 temperature/humidity every minute, get real-world time from DS1307 RTC, and log to microSD card as CSV. The OLED displays live temperature (large font), humidity percentage, timestamp, and log counter. The /temp_log.csv file on the SD card opens in Excel, Google Sheets, or Python pandas for analysis — perfect for greenhouse monitoring, home/room temperature tracking, laboratory data collection, food storage conditions, or beehiv

ESP32 DHT22 Temperature and Humidity (with LCD Display)
This project measures ambient temperature and humidity using a DHT22 sensor and displays the data in real time on a 16x2 I2C LCD. Data is read from the sensor using the one-wire protocol via the Adafruit DHT library. This project serves as the foundation for IoT weather stations, smart home automation, or environmental monitoring systems in greenhouses. Communication with the DHT22 is established via the ESP32's GPIO 4 pin.
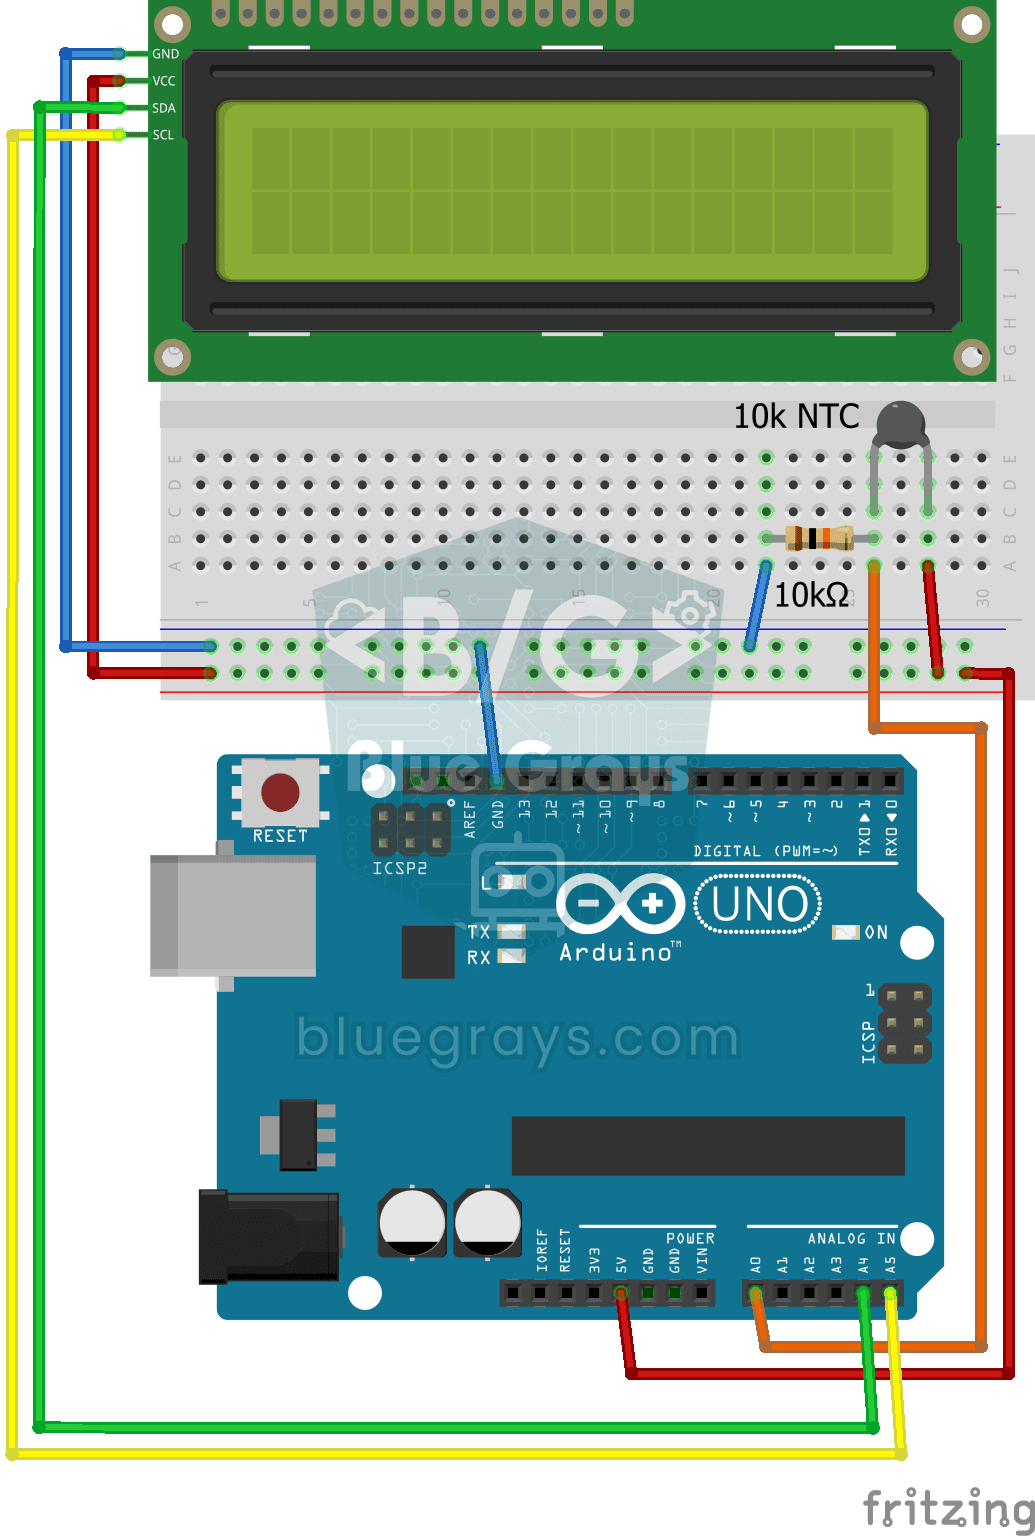
Temperature Measurement with NTC and 2x16 Lcd Display
Measure the temperature around you with a sensor that looks like a tiny bead. This part, called an NTC, lets electricity through more easily as it warms up; the Arduino reads that change, turns it int

Digital Clock with ESP32 and DS1307 RTC (I2C + LCD)
In this project, we display the time and date on a 16x2 I2C LCD screen using the DS1307 real-time clock (RTC) module. The DS1307 is a battery-backed RTC that maintains the time even if the ESP32 is powered off. Both modules share the same I2C bus (SDA/SCL), allowing us to learn how to control multiple devices using just two signal wires. Through this project, you will gain practical knowledge of the I2C communication protocol, RTC module operation, and dynamic data display on an LCD screen.