
Arduino Science Experiments: Data Logging, Tables and Graphs
Arduino science experiments for class: 3 ready labs with DS18B20, LDR and HC-SR04, CSV logging code, Serial Plotter, graphs, a 2-lesson plan and lab report.
Running Arduino science experiments comes down to six steps: students first write a measurable question and a hypothesis, then connect a suitable sensor to the Arduino; the board writes every reading with a timestamp to the serial port as "zaman_ms,deger" (time in ms, value), the curve is watched live in the Serial Plotter, the lines from the Serial Monitor are copied into a spreadsheet as a CSV file, a graph is drawn from the table, and the conclusion is written by comparing the graph with the hypothesis. Unlike measuring by hand with a thermometer and a stopwatch, the Arduino collects 60 points in 10 minutes at equal intervals, without getting tired and without reading errors. That leaves students free to interpret the data instead of copying numbers.
This post gives you three ready-to-run experiments that fit science, physics and biology lessons: the cooling curve of hot water with a DS18B20, how light intensity changes with distance using an LDR, and motion on a ramp with an HC-SR04 (plus a speed of sound measurement). Each experiment comes with its question, variables, materials, a wiring summary, code that compiles, a data table template and the expected result. After that you get the steps for the Serial Plotter and for moving data into a spreadsheet, a measurement error and calibration table, a 2 × 40-minute lesson flow, a short lab report template and safety notes. The examples assume the following: say you have a class of 24, students work in 6 groups of 4, and each group has an Arduino Uno and a computer. We do not go into the wiring details of each sensor here; we link to each sensor's own guide where it comes up.
Arduino science experiments in 6 steps: from question to conclusion
- Question and hypothesis: Pick a measurable question ("Does hot water cool faster in the first 5 minutes or in the next 5?") and have students write the hypothesis as "If … then …, because …". The hypothesis should state a direction or a number; "it changes" is not enough.
- Variables: Have students write the independent variable (what you change: time, distance, slope), the dependent variable (what the sensor measures: temperature, light, position) and the controlled variables (amount of water, the same torch, the same board) into a table. When an experiment goes wrong, the cause is usually a variable that was not kept constant.
- Sensor and code: Connect the sensor and upload the code. The code writes every line as "zaman_ms,deger"; the first line is a header that names the columns. The board keeps time with its own millis() counter, so no stopwatch is needed.
- Live view: Before the recorded run, watch a short trial run in the Serial Plotter. If the curve jumps unexpectedly (a loose wire, a shadow, a hand touching something), fix it on the spot; noticing it after the measurement is too late.
- Data and table: Copy the lines from the Serial Monitor, save them as a .csv file, import it into a spreadsheet and add the unit conversion (ms → s) and the calculated columns.
- Graph and conclusion: Draw an XY (scatter) chart, label both axes with name and unit, compare the graph with the hypothesis and write the conclusion as a sentence based on the data: "Our hypothesis was or was not supported, because …".
Materials list and wiring summary
| Item | Per group | Class total (6 groups) | Experiment |
|---|---|---|---|
| Arduino Uno + USB cable | 1 | 6 | All |
| Computer (Arduino IDE installed) | 1 | 6 | All |
| Breadboard + 10 male-to-male jumper wires | 1 set | 6 sets | All |
| Waterproof DS18B20 probe + 4.7 kΩ resistor | 1 + 1 | 6 + 6 | 1 Cooling |
| Heat-resistant mug (about 250 mL) + measuring jug | 1 + 1 | 6 + 6 | 1 Cooling |
| Hot water (about 60 °C, handed out by the teacher) | 200 mL | 1.2 L + spare | 1 Cooling |
| LDR + 10 kΩ resistor | 1 + 1 | 6 + 6 | 2 Light |
| Small LED torch or phone flashlight + tape measure | 1 + 1 | 6 + 6 | 2 Light |
| HC-SR04 distance sensor | 1 | 6 | 3 Motion |
| 1–1.5 m flat board, 2–3 books, toy car + 10 × 10 cm card | 1 set | 6 sets | 3 Motion |
| Lab thermometer (for comparison) | — | 1 | Calibration |
| Experiment | Sensor | Arduino Uno wiring | Extra parts and notes |
|---|---|---|---|
| 1 Cooling | DS18B20 probe | Red → 5V, black → GND, yellow (DQ) → D2 | 4.7 kΩ resistor between the yellow wire and 5V; libraries OneWire and DallasTemperature |
| 2 Light | LDR | One leg → 5V, other leg → A0 | 10 kΩ resistor between A0 and GND (voltage divider); no library needed |
| 3 Motion and sound | HC-SR04 | VCC → 5V, GND → GND, Trig → D9, Echo → D10 | No extra parts; keep the roughly 15° cone in front of the sensor clear |
Experiment 1: Cooling curve of hot water (DS18B20)
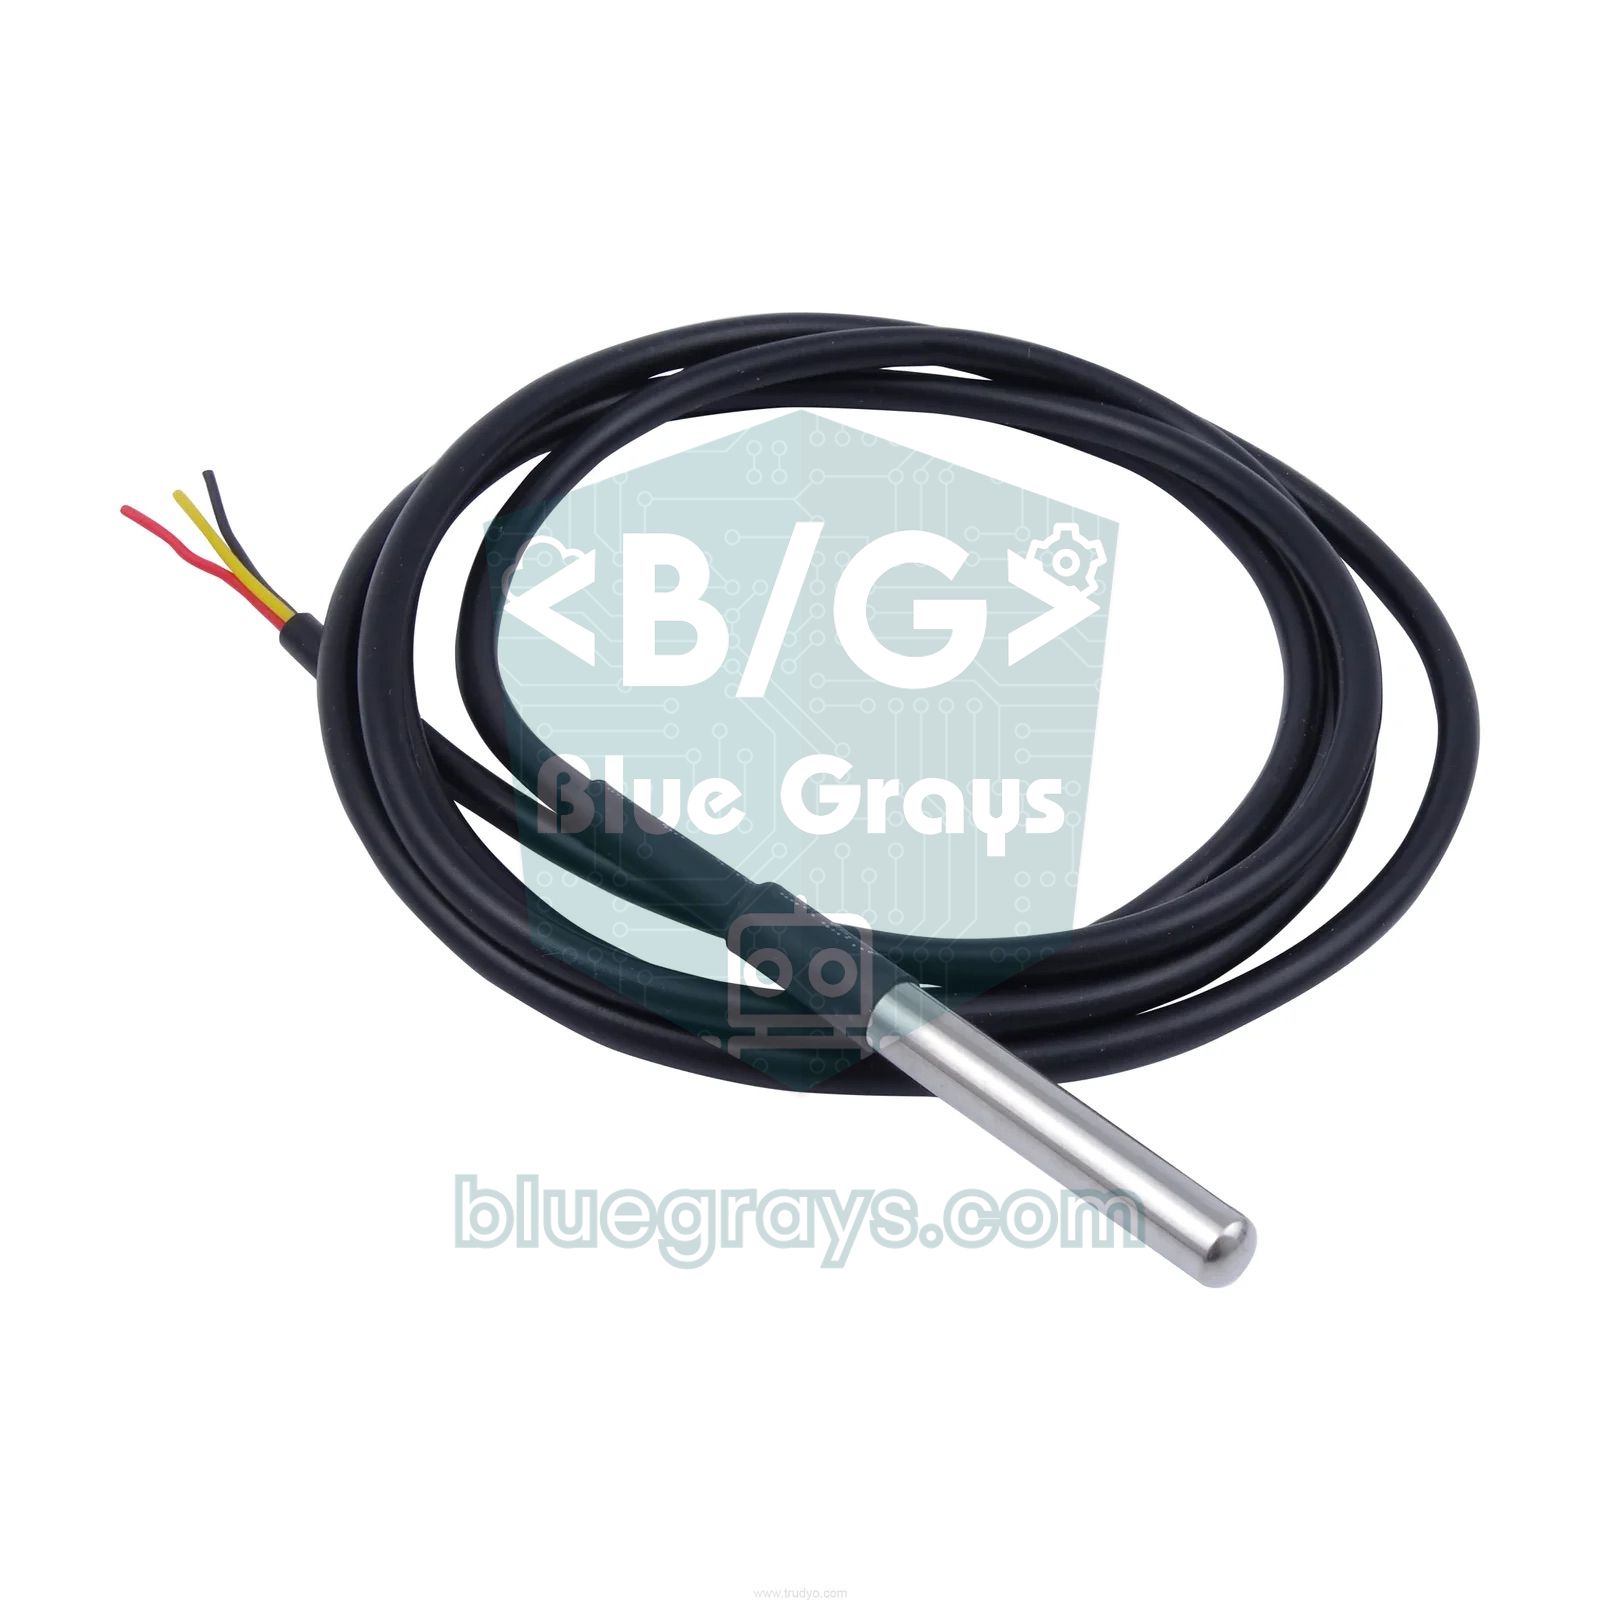
Question: Does hot water cool by the same amount every minute, or does the cooling slow down over time? Example hypothesis: "Cooling is fast while the temperature difference between the water and the room is large, and slows down as the difference shrinks." The independent variable is time and the dependent variable is the water temperature; the controlled variables are the amount of water (200 mL), the type of container, where it stands on the table and the room temperature. You can give groups a second question too: is there a difference between a mug with a lid and one without, or between a glass and a paper cup? Then the container becomes the independent variable, two groups measure at the same time and compare their curves. For wiring and installing the libraries, see the DS18B20 guide. If you only have a DHT11, never put it in water: the safe equivalent with a DHT11 is to warm the sensor in your hand for a minute, put it down on the table and measure how it cools in the air (DHT11 guide).
1// Deney 1: Sıcak suyun soğuma eğrisi / Experiment 1: cooling curve of hot water
2// Kütüphaneler: OneWire + DallasTemperature / Libraries: OneWire + DallasTemperature
3#include <OneWire.h>
4#include <DallasTemperature.h>
5
6const int ONE_WIRE_PIN = 2;                // DS18B20 veri (DQ) pini / data (DQ) pin
7const unsigned long INTERVAL_MS = 10000;   // 10 saniyede bir ölçüm / one reading every 10 s
8const bool PLOTTER_MODE = false;           // true: Serial Plotter için yalnız değer / value only for Serial Plotter
9
10OneWire oneWire(ONE_WIRE_PIN);
11DallasTemperature sensors(&oneWire);
12unsigned long startMs = 0;
13unsigned long lastMs = 0;
14
15void setup() {
16  Serial.begin(9600);
17  sensors.begin();
18  if (!PLOTTER_MODE) {
19    Serial.println("zaman_ms,sicaklik_C");  // CSV başlık satırı / CSV header line
20  }
21  startMs = millis();
22  lastMs = startMs - INTERVAL_MS;           // ilk ölçüm hemen / first reading right away
23}
24
25void loop() {
26  unsigned long now = millis();
27  if (now - lastMs < INTERVAL_MS) {
28    return;                                 // daha zamanı gelmedi / not time yet
29  }
30  lastMs += INTERVAL_MS;                    // kaymayan zamanlama / drift-free timing
31
32  sensors.requestTemperatures();            // ölçümü başlat (~750 ms) / start conversion (~750 ms)
33  float tempC = sensors.getTempCByIndex(0);
34  if (tempC == DEVICE_DISCONNECTED_C) {     // sensör yanıt vermedi / sensor did not respond
35    return;
36  }
37
38  if (PLOTTER_MODE) {
39    Serial.print("sicaklik_C:");
40    Serial.println(tempC, 2);
41  } else {
42    Serial.print(now - startMs);            // deney başından beri ms / ms since start
43    Serial.print(",");
44    Serial.println(tempC, 2);
45  }
46}| Time (s) | Water temperature T (°C) | Room temperature T_room (°C) | Difference ΔT = T − T_room (°C) | Remaining ratio ΔT / ΔT₀ |
|---|---|---|---|---|
| 0 | … | … | … | 1.00 |
| 60 | … | … | … | … |
| 120 | … | … | … | … |
| 300 | … | … | … | … |
| 600 | … | … | … | … |
| 900 | … | … | … | … |
| 1200 | … | … | … | … |
The code writes one line every 10 seconds, so a 20-minute run gives 120 lines. Time comes from the board's millis() counter, and because exactly 10,000 is added to lastMs each time, the readings do not drift; the technique is explained in the millis() and delay() post. Set PLOTTER_MODE at the top of the code to true and the time column disappears, so the Serial Plotter draws only the temperature. The template above is the summary table for the report, while the full data stays in the CSV file; measure the room temperature in the air with the same sensor at the start and write it down. Expected result: The curve is not a straight line but one that gradually flattens: the temperature drops fast in the first minutes, then the drop slows down. This is Newton's law of cooling: the rate of cooling is proportional to the temperature difference between the object and its surroundings. Students who work out the last column will see that the difference shrinks by roughly the same ratio in equal time intervals; say the difference halved in the first 8 minutes, then it halves again in the next 8. A mug with a lid cools more slowly, because less heat is lost through evaporation. In biology, the same experiment repeated with small and large containers leads into a discussion of why small animals lose heat faster.
Experiment 2: Light intensity and distance (LDR)
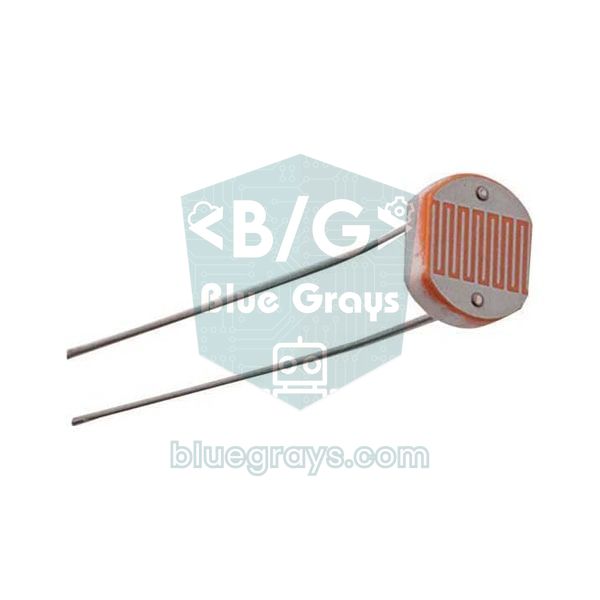
Question: How does light intensity decrease as you move away from a light source; when the distance doubles, does the light drop to a half or to a quarter? Example hypothesis: "When the distance doubles, the light intensity drops to a quarter." The independent variable is the distance from the torch to the LDR (10, 15, 20, 30, 40 and 50 cm), the dependent variable is the value read from A0; the controlled variables are the same torch, the same batteries, the torch facing the LDR straight on, and the ambient light. Run the experiment with the blinds closed and, if possible, the room lights dimmed; with strong ambient light the torch's contribution gets lost at larger distances. With this wiring the reading goes up as the light increases; the idea behind the voltage divider is in the LDR guide. Slide the torch along the tape measure, wait 5 seconds at each distance until the value settles, and write three consecutive values from the Serial Monitor into the table. At the start, take one reading with the torch off: this is the background value of the room. If the value at the farthest distance is very close to the background, leave that distance out of the graph.
1// Deney 2: Işık şiddeti ve mesafe / Experiment 2: light intensity and distance
2// Bağlantı: 5V - LDR - A0 - 10 kΩ - GND / Wiring: 5V - LDR - A0 - 10 kΩ - GND
3const int LDR_PIN = A0;                    // bölücünün orta noktası / divider midpoint
4const unsigned long INTERVAL_MS = 500;     // yarım saniyede bir satır / one line every 0.5 s
5const int SAMPLES = 16;                    // ortalama için örnek sayısı / samples per average
6const bool PLOTTER_MODE = false;           // true: Serial Plotter için yalnız değer / value only for Serial Plotter
7
8unsigned long startMs = 0;
9unsigned long lastMs = 0;
10
11int readAverage() {
12  long sum = 0;
13  for (int i = 0; i < SAMPLES; i++) {
14    sum += analogRead(LDR_PIN);             // 0 (karanlık) ... 1023 (aydınlık) / dark ... bright
15    delay(2);
16  }
17  return (int)(sum / SAMPLES);              // gürültüyü azaltır / reduces noise
18}
19
20void setup() {
21  Serial.begin(9600);
22  if (!PLOTTER_MODE) {
23    Serial.println("zaman_ms,ldr_ham");     // CSV başlık satırı / CSV header line
24  }
25  startMs = millis();
26  lastMs = startMs - INTERVAL_MS;           // ilk ölçüm hemen / first reading right away
27}
28
29void loop() {
30  unsigned long now = millis();
31  if (now - lastMs < INTERVAL_MS) {
32    return;
33  }
34  lastMs += INTERVAL_MS;
35
36  int raw = readAverage();
37  if (PLOTTER_MODE) {
38    Serial.print("ldr_ham:");
39    Serial.println(raw);
40  } else {
41    Serial.print(now - startMs);            // deney başından beri ms / ms since start
42    Serial.print(",");
43    Serial.println(raw);
44  }
45}| Distance d (cm) | 1 / d² (1/cm²) | Reading 1 | Reading 2 | Reading 3 | Raw average | LDR resistance (Ω) |
|---|---|---|---|---|---|---|
| Torch off | — | … | … | … | … | … |
| 10 | 0.0100 | … | … | … | … | … |
| 15 | 0.0044 | … | … | … | … | … |
| 20 | 0.0025 | … | … | … | … | … |
| 30 | 0.0011 | … | … | … | … | … |
| 40 | 0.0006 | … | … | … | … | … |
| 50 | 0.0004 | … | … | … | … | … |
Every half second the code prints the average of 16 readings, which smooths out the small jitter in single analogRead values. To calculate the LDR resistance, if the raw average is in column F, type =10000*(1023-F3)/F3 in column G and fill it down (for a 10 kΩ fixed resistor and the LDR connected to 5V). Expected result: The reading falls as the distance grows, quickly up close and slowly further away. However, the raw value does not drop to a quarter between 10 cm and 20 cm, because the raw number is not the light intensity but a measure of the divider voltage. To see the inverse square law, plot distance against LDR resistance on a chart with both axes logarithmic: the points line up roughly on a straight line. Light intensity is inversely proportional to the square of the distance, and the LDR's resistance is roughly inversely proportional to the light intensity raised to a power γ; so the slope of the line comes out not as 2 but as 2 × γ. For common LDRs γ is usually between 0.5 and 0.9, so expect a slope between 1 and 1.8. In a high school physics class this is a good opening for the question "how does the behaviour of the measuring instrument itself affect the result?"
Experiment 3: Motion on a ramp and the speed of sound (HC-SR04)
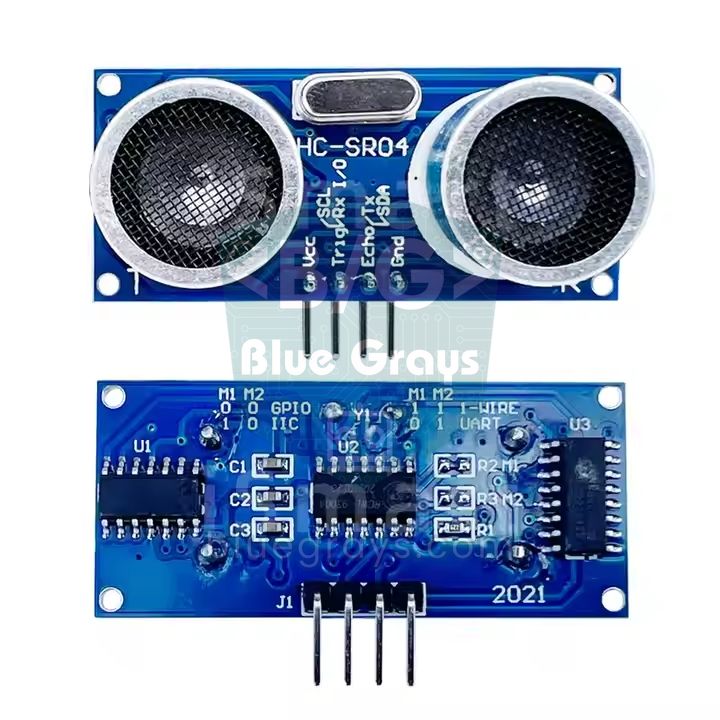
Question: Does a car released on a ramp roll down at a constant speed, or does it keep speeding up? How does the acceleration change when the slope increases? Example hypothesis: "The car covers more and more distance in equal time intervals, so it speeds up; a steeper slope makes it speed up faster." The independent variable is time (and the slope in a second round: 1, 2 and 3 books), the dependent variable is the car's distance from the sensor; the controlled variables are the car, the release point and the board. Setup: raise one end of a flat 1–1.5 m board with books and place the HC-SR04 at the low end, facing up the board. Stick a 10 × 10 cm piece of card to the back of a toy car; the sensor cannot get a reliable echo from small, round objects, while a flat card gives a strong echo. Hold the car about 100 cm from the sensor, let it go, and put a book in front of the sensor so the car does not crash into it. How the sensor works and its range are covered in the HC-SR04 guide.
1// Deney 3: Eğik düzlemde hareket ve ses hızı / Experiment 3: motion on a ramp and speed of sound
2const int TRIG_PIN = 9;                    // tetik / trigger
3const int ECHO_PIN = 10;                   // yankı / echo
4const unsigned long INTERVAL_MS = 60;      // ölçümler arası en az ~60 ms / at least ~60 ms between pings
5const bool PLOTTER_MODE = false;           // true: Serial Plotter için yalnız değer / value only for Serial Plotter
6const bool RAW_ECHO_US = false;            // true: ses hızı deneyi için yankı süresi (µs) / echo time for speed of sound
7
8unsigned long startMs = 0;
9unsigned long lastMs = 0;
10
11void setup() {
12  pinMode(TRIG_PIN, OUTPUT);
13  pinMode(ECHO_PIN, INPUT);
14  digitalWrite(TRIG_PIN, LOW);
15  Serial.begin(9600);
16  if (!PLOTTER_MODE) {
17    Serial.println(RAW_ECHO_US ? "zaman_ms,yanki_us" : "zaman_ms,mesafe_cm");  // CSV başlığı / CSV header
18  }
19  startMs = millis();
20  lastMs = startMs - INTERVAL_MS;           // ilk ölçüm hemen / first reading right away
21}
22
23void loop() {
24  unsigned long now = millis();
25  if (now - lastMs < INTERVAL_MS) {
26    return;
27  }
28  lastMs += INTERVAL_MS;
29
30  digitalWrite(TRIG_PIN, LOW);
31  delayMicroseconds(2);
32  digitalWrite(TRIG_PIN, HIGH);             // 10 µs tetik darbesi / 10 µs trigger pulse
33  delayMicroseconds(10);
34  digitalWrite(TRIG_PIN, LOW);
35
36  unsigned long echoUs = pulseIn(ECHO_PIN, HIGH, 25000UL);  // en fazla 25 ms (~4 m) / max 25 ms (~4 m)
37  if (echoUs == 0) {                        // yankı yok, satırı atla / no echo, skip the line
38    return;
39  }
40  float distanceCm = echoUs * 0.0343 / 2.0; // 343 m/s, gidiş-dönüş / round trip
41
42  if (PLOTTER_MODE) {
43    Serial.print("mesafe_cm:");
44    Serial.println(distanceCm, 1);
45  } else {
46    Serial.print(now - startMs);            // deney başından beri ms / ms since start
47    Serial.print(",");
48    if (RAW_ECHO_US) {
49      Serial.println(echoUs);
50    } else {
51      Serial.println(distanceCm, 1);
52    }
53  }
54}| Column | Header | Content or formula | What it shows |
|---|---|---|---|
| A | zaman_ms | From the CSV | Time since the start of the run |
| B | mesafe_cm | From the CSV | The car's distance from the sensor |
| C | zaman_s | =A2/1000 | Horizontal axis of the graph |
| D | yol_cm | =B$2-B2 | Distance travelled from the release point |
| E | hiz_cm_s | =(D7-D2)/(C7-C2), starting at E7 | Average speed over about 0.3 s |
| F | kosul | 1, 2 or 3 books | Which run the row belongs to |
The code prints a line every 60 ms, about 16 lines per second; this gap between readings is recommended so the HC-SR04's echoes do not mix. If no echo comes back (the object is out of range or at an angle), that line is skipped. Work out the speed not from two consecutive lines but from lines 5 rows apart; with a 60 ms interval, even 1–2 mm of measurement jitter makes the speed jump around a lot. Expected result: The position-time graph is not a straight line but a curve that gets steeper (a parabola), while the speed-time graph is roughly a straight line: the car speeds up with constant acceleration, and the slope of that line gives the acceleration. On a frictionless ramp the acceleration would be g × sin θ: a 1.5 m board raised by 10 cm gives sin θ ≈ 0.067, so roughly 65 cm/s². A measured value below this is due to friction and the rotation of the wheels, and goes into the report as a source of error. Speed of sound variation: Set RAW_ECHO_US to true, place a flat piece of card in front of the sensor at 20, 40, 60, 80 and 100 cm and average the echo time at each distance. On a graph with the round-trip distance (2 × d) on the horizontal axis and the time on the vertical axis, the slope is 1/v; v comes out around 340 m/s at room temperature and increases with temperature (roughly v ≈ 331 + 0.6 × T m/s). The slope method also automatically removes the constant delay inside the sensor.
Serial Plotter and moving the data into a spreadsheet
- After uploading the code, open Tools > Serial Monitor and set the speed to 9600 baud, as in the code. Keep the timestamp button off; if it is on, the computer's clock is added to the start of every line and the CSV breaks.
- Before measuring, clear the output and press the board's RESET button. Time then starts from 0 and the first line is a header such as zaman_ms,sicaklik_C.
- For a live graph, set PLOTTER_MODE to true in the code, upload again and open Tools > Serial Plotter. The Serial Plotter does not save data, it only displays it; so use it for the trial run and set PLOTTER_MODE back to false for the recorded run.
- When the measurement is done, select the lines in the Serial Monitor with the mouse from the header line to the last line and copy them with Ctrl+C (Cmd+C on macOS). Paste them into a plain text editor and save with a name that includes group, experiment and date, such as group2-cooling-1104.csv.
- Import the file into a spreadsheet: in Excel use Data > From Text/CSV, in Google Sheets File > Import, and in LibreOffice Calc simply open the file. Choose the comma as the separator.
- Watch the decimal separator: the Arduino writes numbers with a dot, like 23.50, while spreadsheets set to many European locales expect a comma. If needed, choose English (United States) as the locale on import or replace the dots with commas; otherwise 23.50 is read as text or a date and the chart comes out empty.
- Add the calculated columns (ms → s, difference, ratio, speed) and draw the chart as an XY scatter chart. A line chart treats the horizontal axis as evenly spaced categories, so the time axis gets distorted where lines were skipped.
A good experiment graph has four things: the independent variable on the horizontal axis, the dependent variable on the vertical axis, a name and unit on both axes ("Time (s)", "Temperature (°C)") and a title that says what it shows ("Cooling of 200 mL of water in an open mug"). Showing two conditions on the same chart in different colours (with and without a lid, 1 and 3 books) makes the comparison visible at a glance. Before students look at their graph, ask them to answer "If our hypothesis is right, what should the graph look like?" with a rough sketch on paper; putting the real graph next to the sketch is the easiest way to write the conclusion. The conclusion should always rest on a number: "The water cooled by … °C in the first 5 minutes and by … °C in the next 5." How to fix the scale and label lines in the Serial Plotter is explained in the Serial Monitor guide. If you would rather not copy long runs by hand, you can write the data straight to a file with Python, or for measurements without a computer, log CSV to an SD card module.
Measurement errors and calibration
| Topic | What to know | What to do in class |
|---|---|---|
| DS18B20 accuracy | ±0.5 °C between −10 and +85 °C; at 12 bits one reading takes about 750 ms. | Before measuring, put all probes in the same container of ice water; note how far each is from 0 °C and correct for it in the table. |
| DHT11 accuracy | ±2 °C between 0 and 50 °C; at most 1 reading per second, slow response. | Never put it in water, use it only for experiments in air; do not read it more often than once a second. |
| LDR | Not linear, varies from part to part; the value takes time to settle after the light changes. | Use the same LDR throughout, wait 5 s at each distance, and interpret the result only within the group's own data. |
| HC-SR04 | 2–400 cm, resolution about 3 mm; the speed of sound changes by about 0.6 m/s per 1 °C; a cone of about 15°. | Check at 20 and 50 cm with a tape measure; the target should be flat and face the sensor, with nothing else in the way. |
| Sampling rate | Sampling too rarely misses the shape of the curve, sampling too often produces noise and needlessly large files. | Choose by how long the event lasts: cooling 10 s, light 0.5 s, motion 60 ms. Aim for at least 20–30 points over the event. |
| Repeat measurements | A single reading can be luck; repeats show how reliable the result is. | Measure each condition at least 3 times; report the average and the difference between the largest and smallest value (the spread). |
| Time | With a hand-held stopwatch, human reaction time is about 0.2 s. | Leave timing to the board's millis() counter; use hand timing only as a check. |
Lesson flow: 2 × 40 minutes
The flow below works for all three experiments. For the first time, we suggest giving Experiment 1 to every group: it is the simplest to set up, and groups can prepare their tables while the measurement runs on its own. Once the class is used to it, you can split the 6 groups into three stations of two; with two groups doing each experiment, they can also compare their results. Uploading the code to the boards before the lesson saves 8–10 minutes of the first lesson. For role cards and station layouts in large classes see the large class post, and for materials and table layout the school lab guide.
| Lesson and minutes | Teacher | Groups | Output |
|---|---|---|---|
| Lesson 1, 0–5 | Opens the question with an everyday observation: "Why does tea cool fastest in the first few minutes?" | Write the question in their notebooks, share first guesses. | Experiment question |
| Lesson 1, 5–12 | Explains the hypothesis pattern and the types of variables, assigns roles: experimenter, timing and checks, data lead, reporter. | Write the hypothesis and the variables table. | Hypothesis and variables table |
| Lesson 1, 12–20 | Shows the wiring table; may have uploaded the code in advance. | Build the circuit, see the header line and first values in the Serial Monitor. | Working circuit |
| Lesson 1, 20–35 | Walks around the groups, checks the controlled variables. | Take the measurements: 15 minutes for cooling, 7 conditions × 3 repeats for light, 3 slopes × 3 runs for motion. | Raw data |
| Lesson 1, 35–40 | Reminds students of the file naming rule. | Copy the data, save it as .csv, put it in the shared folder. | CSV file |
| Lesson 2, 0–10 | Shows the decimal separator and import steps on the board. | Import the CSV into a spreadsheet, add the calculated columns. | Clean table |
| Lesson 2, 10–22 | Reminds students of the axis name, unit and title rule. | Draw the XY chart, compare it with the hypothesis sketch. | Graph |
| Lesson 2, 22–32 | Asks which rows of the error table apply to the group's experiment. | Write the conclusion and the sources of error. | Conclusion and error paragraph |
| Lesson 2, 32–37 | Runs the graph tour. | Explain their graph to the next group in 1 minute, take one question. | Peer feedback |
| Lesson 2, 37–40 | Asks two of the exit questions below. | Write short answers on paper. | Exit ticket |
- What were your independent and dependent variables, and which variable did you keep constant?
- In which part of the graph is the change fastest, and how can you tell from the graph?
- Was your hypothesis supported? Which two numbers do you base that on?
- How would your graph change if you measured every 60 seconds instead of every 10?
- What was the biggest source of error, and what would you change if you did the experiment again?
Assessment: a short lab report template
- Title and question: Name of the experiment, group members, date and the experiment question in one sentence.
- Hypothesis: In the "If … then …, because …" pattern, exactly as written before measuring; it is not corrected afterwards.
- Variables: Independent, dependent and at least two controlled variables.
- Materials and method: Sensor, wiring summary, sampling interval and number of repeats; clear enough for another group to repeat the experiment, in no more than 6 steps.
- Data: A summary table like the template, plus the name of the CSV file.
- Graph: An XY chart with axis names, units and a title.
- Conclusion: Was the hypothesis supported? 2–3 sentences based on one or two numbers.
- Sources of error and improvements: At least two sources of error and what you would change if you repeated the experiment. For marking, you can adapt the criteria from the Arduino lesson rubric post to these sections.
Ready sensor projects, Understand the code and tools in the app
BlueGrays has ready projects with a circuit diagram, parts list and code for every sensor in these experiments; students can use them to get to know a sensor before the experiment. The free ones: Measuring Light Intensity with an LDR, HC-SR04 Distance Measurement (Serial Display) and Temperature and Humidity with DHT11; if you use an ESP32, Reading Light Intensity with the ESP32 LDR Module, ESP32 HC-SR04 Ultrasonic Distance Sensor and ESP32 DHT22 Temperature and Humidity (with LCD Display) are free as well. In free projects the blocks and the Understand the code section are open too: students read what the code does step by step and make a small change themselves in the Try it yourself task; how to use the section in class is in the Understand the code post. To calculate the divider voltage in the LDR experiment, the Voltage divider tool (Premium) does the job, and the free Color code and Ohm's law tools help you check the resistors. If you want to open Premium sensor projects such as Temperature Measurement with NTC and 2x16 Lcd Display, which shows the temperature on an LCD, or ESP32 Temperature Data Logger (DHT22 + DS1307 RTC + microSD + OLED), which saves data to a microSD card, to the whole class, that is what the one-time educator packages are for: students get Premium without adding a card.
Safety: hot water, electricity and water nearby
- Hot water: Do not use boiling water; about 60 °C is enough and still gives a clear curve. Let the teacher hand out the water, and keep the mugs in the middle of the table where no cable can catch them. During the measurement the mug is not held or moved.
- Water and electricity: Only the metal tip of the waterproof probe goes into the water. Keep the Arduino, breadboard and computer at least 30 cm from the water, ideally on a separate tray. If water is spilled on the table, unplug the USB cable first, then wipe it up.
- USB power only: All of these experiments run from the computer's USB port; no mains-powered device (kettle, lamp, heater) is ever connected to the Arduino circuit.
- Wiring: Make and change connections only with the USB unplugged. If a part gets hot or you smell something, unplug the USB right away.
- Light: Do not point the torch at anyone's eyes; looking into a strong LED torch up close is uncomfortable for the eyes.
- Ramp: The board should not stick out over the edge of the table, the car should be stopped by a book before it hits the sensor, and the books under the board should be placed so they cannot slide.
One sensor, clean CSV output and a well-asked question turn a science experiment from repeating the result in the textbook into a real measurement study: students draw their own graphs, discuss their own sources of error and defend the conclusion with their own numbers. If you want to get to know the sensors and build the circuits step by step on your phone before the experiment, you can start with the free LDR, HC-SR04 and DHT11 projects in the BlueGrays app.
Frequently asked questions
What science experiments can you do with an Arduino?
Any quantity a sensor can measure can become an experiment: temperature (cooling, heating, insulation), light (distance, coloured filters), distance and motion (ramps, pendulums), soil moisture (plant experiments), sound and pressure. To start, the cooling curve, light vs distance and the ramp experiment are the three that are easiest to set up and give the clearest results.
How do I get Arduino data into Excel?
The simplest way is for the code to write the data to the serial port as comma-separated lines such as "zaman_ms,deger". You copy the lines from the Serial Monitor, save them as a .csv file and import it in Excel with Data > From Text/CSV. If your Excel uses a comma as the decimal separator, set the locale to English (United States) on import, or the numbers are read as text.
Does the Arduino Serial Plotter save data?
No, the Serial Plotter only shows a live graph and does not write the data to a file. To keep the data you need to copy the CSV lines from the Serial Monitor, write them to a file with a Python script, or use an SD card module.
Should I use a DS18B20 or a DHT11 for a science experiment?
If you are measuring water or another liquid, use a DS18B20 in its waterproof probe version; its ±0.5 °C accuracy and a tip that can go into water make it a good fit for cooling experiments. The DHT11 measures air temperature and humidity with ±2 °C accuracy, cannot go into water and responds slowly; use it only for experiments in air.
How do you measure the speed of sound with an Arduino?
Print the HC-SR04's echo time in microseconds and place a flat piece of card in front of the sensor at different distances. Plot the round-trip distance (2 × distance) against the echo time; the slope of the line gives the speed of sound, which comes out at about 340 m/s at room temperature.
How many lessons does an Arduino science experiment take?
Two 40-minute lessons are enough for one experiment: the first for the hypothesis, setup and measurement, the second for the table, graph, conclusion and report. If the code is uploaded to the boards before the lesson, there is more time left for measuring in the first lesson.
Projects to build after reading this
See all projects
Measuring Light Intensity with an LDR
Want to see how bright your room is as a number? The LDR, a small part that reacts to light, measures the light around it, and the Arduino writes the value to your computer screen every half second. C
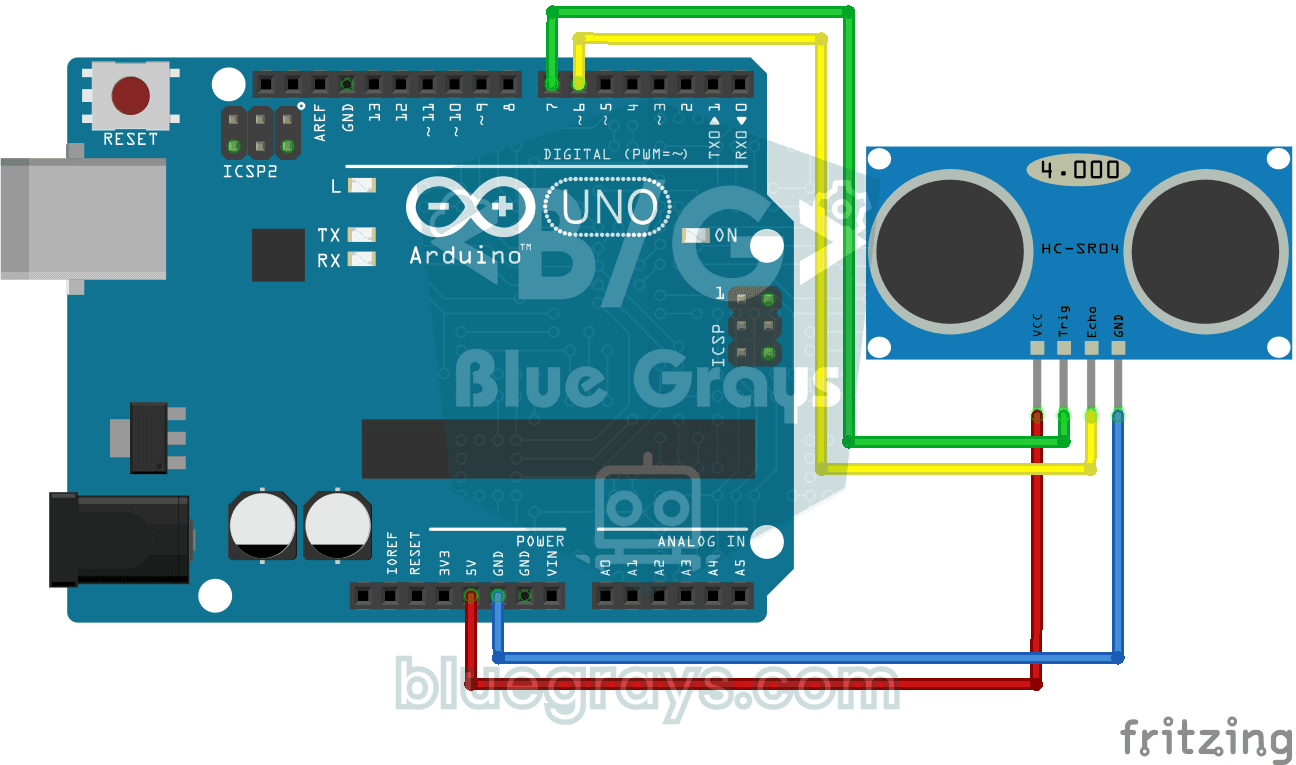
HC-SR04 Distance Measurement (Serial Display)
The HC-SR04 sensor works just like a bat finding its way in the dark: it sends out a sound you cannot hear, listens for the echo and measures how far away the object in front of it is. The Arduino wri
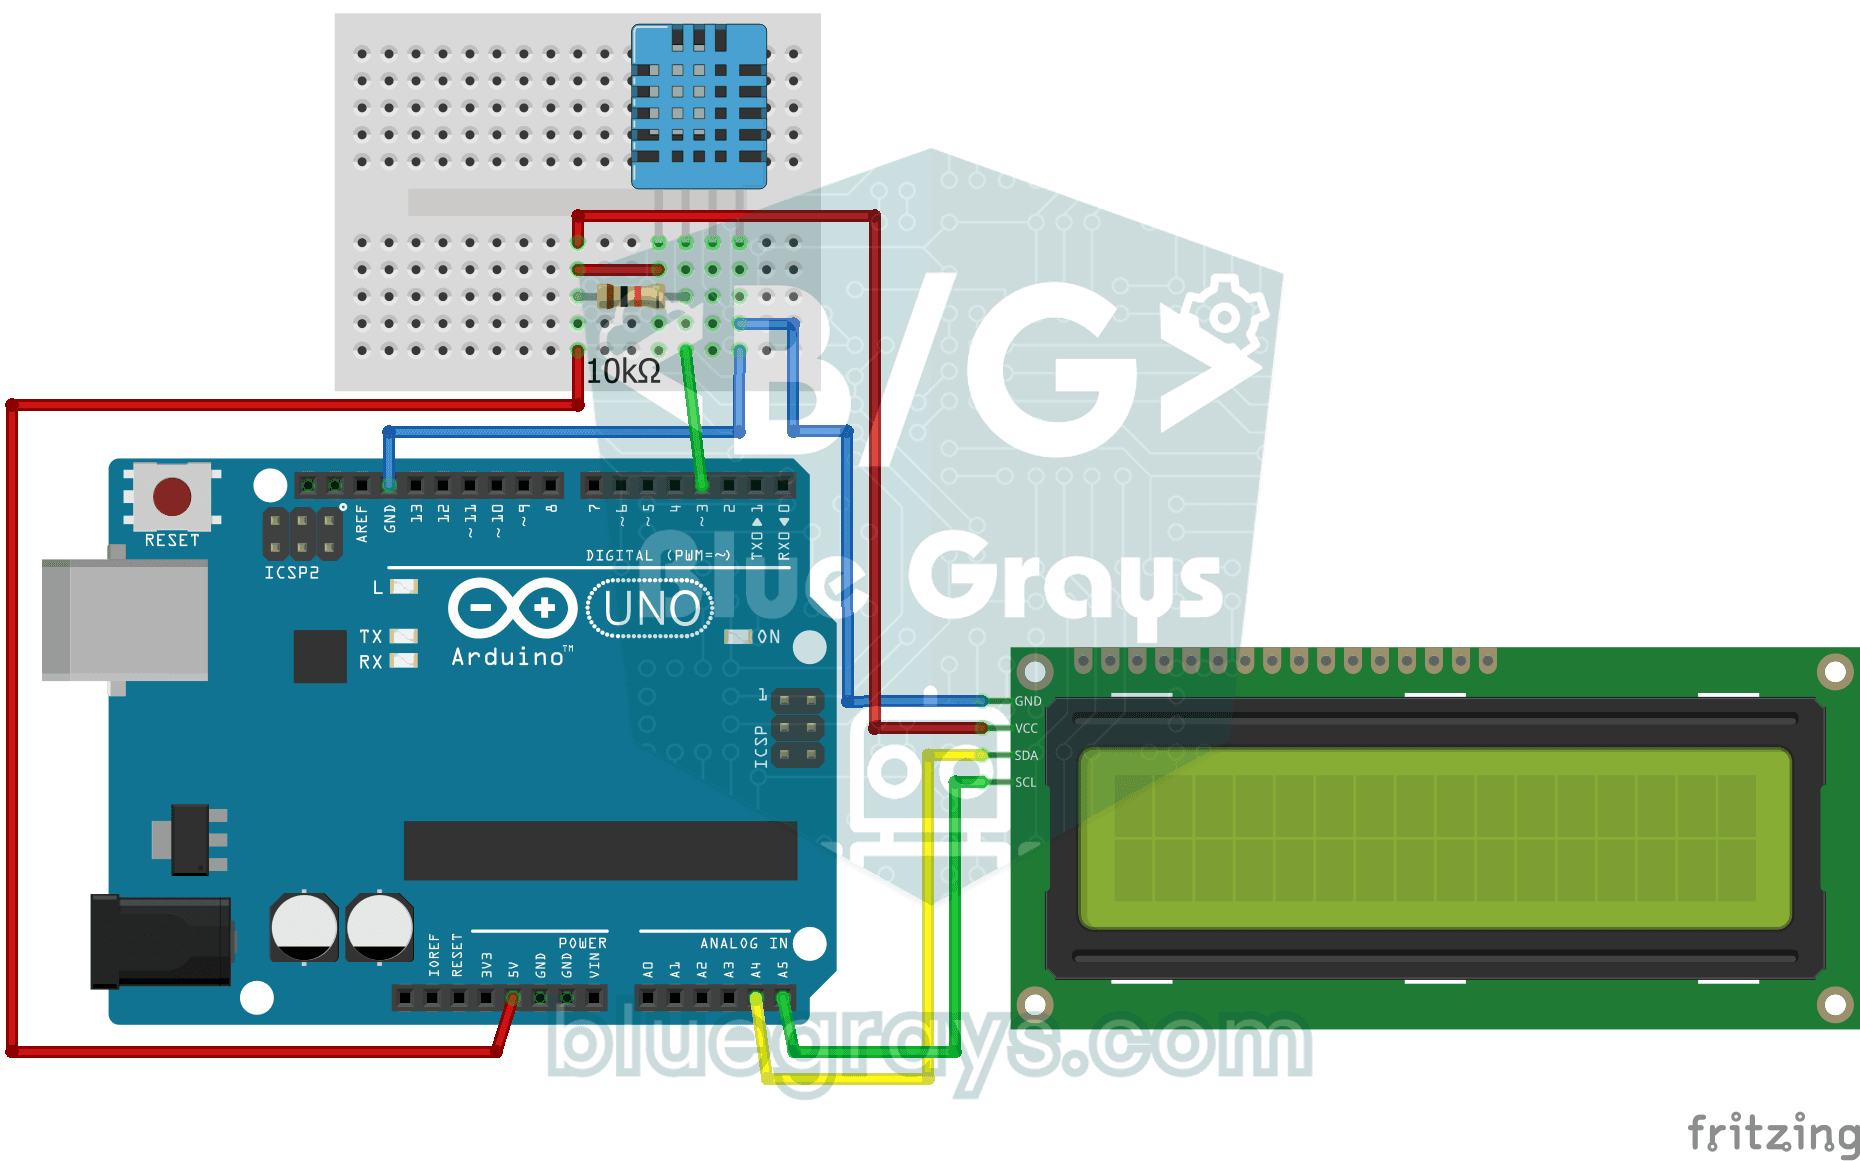
Temperature and Humidity with DHT11
How warm is your room, and is the air humid or dry? The DHT11 sensor measures temperature and humidity, and the Arduino writes the values on a two-line LCD screen, refreshing every couple of seconds.

Reading Light Intensity with the ESP32 LDR Module
Real-time monitoring of the LDR module's raw ADC value and relative light percentage calculated from dark and light reference values in the Serial Monitor. This percentage is not a lux measurement. Teaches the module’s calibration logic. It is ideal to complete this before Project 10, as it is used to determine the threshold value.

ESP32 HC-SR04 Ultrasonic Distance Sensor
The HC-SR04 ultrasonic sensor calculates distance by measuring the time it takes for the sound wave it emits to bounce off an object and return (Time of Flight). In this project, we will send a 10-microsecond pulse from the ESP32 to the sensor's TRIG pin and read the echo duration from the ECHO pin using pulseIn(). We will display the calculated distance in centimeters on a 16x2 I2C LCD. Since the HC-SR04 operates at 5V, a voltage divider is required on the ECHO pin—otherwise, the ESP32’s

ESP32 DHT22 Temperature and Humidity (with LCD Display)
This project measures ambient temperature and humidity using a DHT22 sensor and displays the data in real time on a 16x2 I2C LCD. Data is read from the sensor using the one-wire protocol via the Adafruit DHT library. This project serves as the foundation for IoT weather stations, smart home automation, or environmental monitoring systems in greenhouses. Communication with the DHT22 is established via the ESP32's GPIO 4 pin.
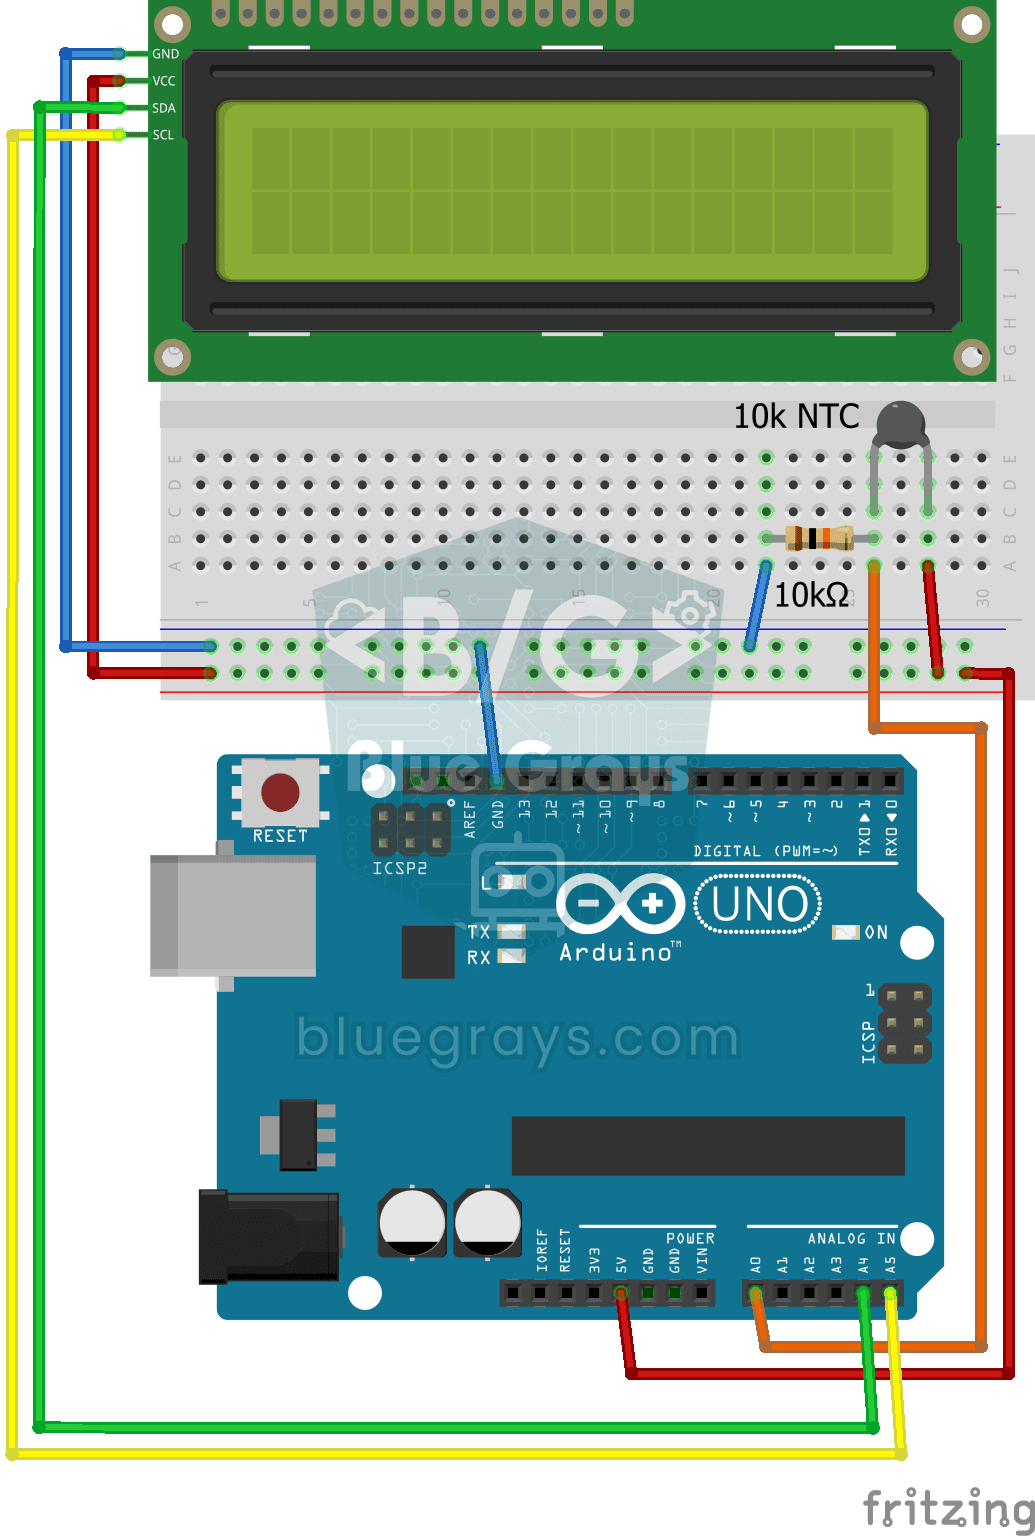
Temperature Measurement with NTC and 2x16 Lcd Display
Measure the temperature around you with a sensor that looks like a tiny bead. This part, called an NTC, lets electricity through more easily as it warms up; the Arduino reads that change, turns it int
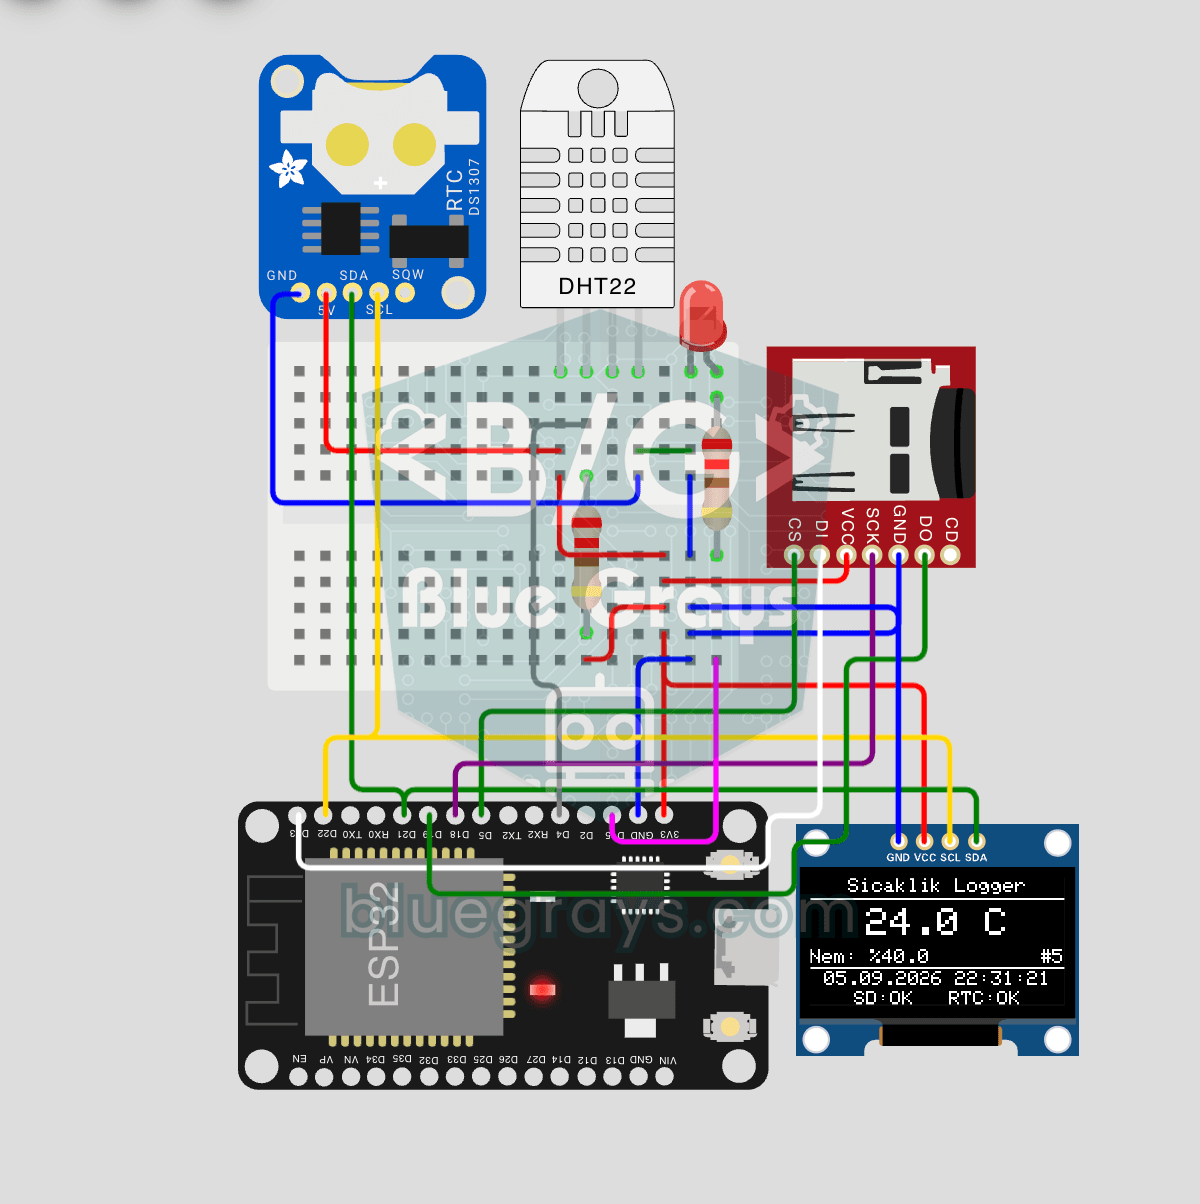
ESP32 Temperature Data Logger (DHT22 + DS1307 RTC + microSD + OLED)
Build a timestamped temperature logger with ESP32! Read DHT22 temperature/humidity every minute, get real-world time from DS1307 RTC, and log to microSD card as CSV. The OLED displays live temperature (large font), humidity percentage, timestamp, and log counter. The /temp_log.csv file on the SD card opens in Excel, Google Sheets, or Python pandas for analysis — perfect for greenhouse monitoring, home/room temperature tracking, laboratory data collection, food storage conditions, or beehiv