
MQ135 Arduino Tutorial: Air Quality Sensor, Calibration and PPM
MQ135 Arduino guide: which gases it detects, 24–48 h burn-in, R0 calibration and the ppm formula, can it measure CO2, fan control, ESP32 logging vs CCS811.
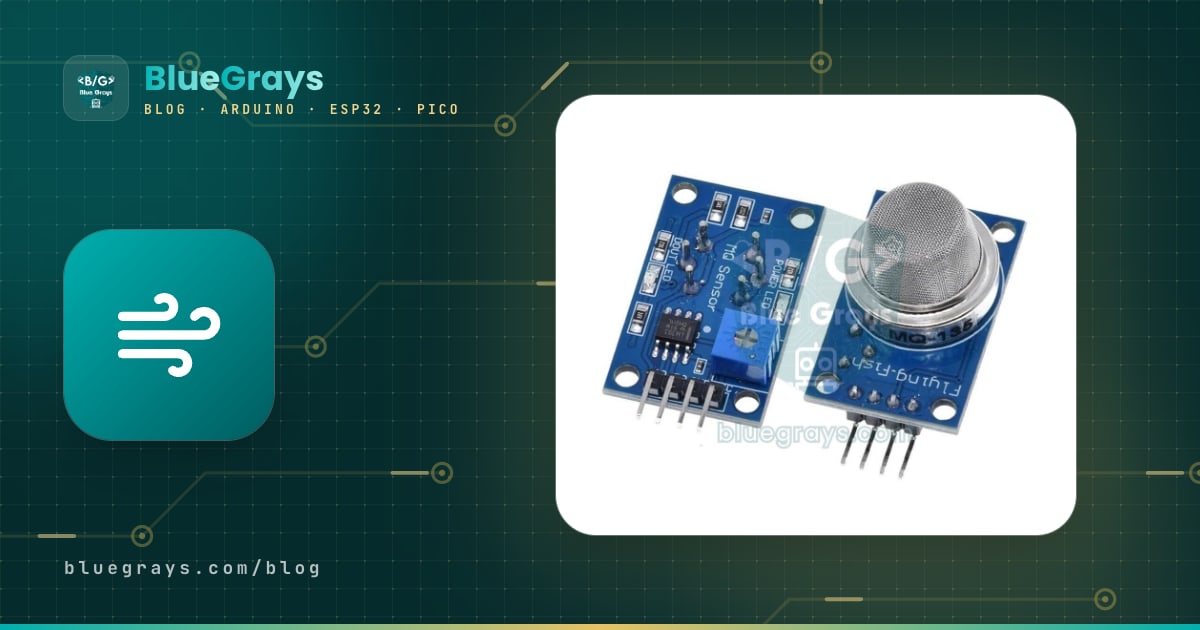
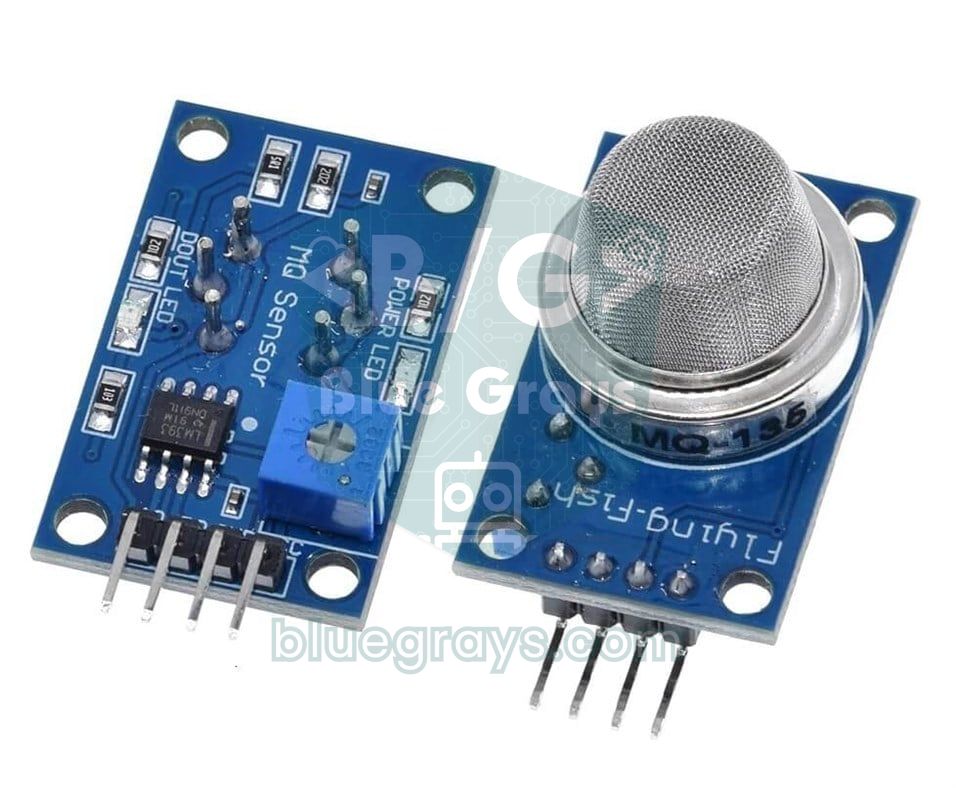
MQ135 Arduino projects are the first stop for anyone who wants a cheap, simple way to keep an eye on how clean the air in a room is. The MQ-135 is a heated metal-oxide gas sensor that reacts to gases such as ammonia, nitrogen oxides, benzene, alcohol and smoke. In hobby kits it usually comes as a small module with a comparator chip and an adjustment potentiometer; it connects to the Arduino through its analog output and is read with a single analogRead(). But turning the number this sensor gives you into a meaningful measurement takes a bit more knowledge than most tutorials explain.
In this guide you'll learn what goes on inside the sensor, how sensitive it is to which gases and why it needs 24–48 hours of heating before its first real use. Then we'll build the ppm calculation step by step using the load resistor (RL), sensor resistance (Rs) and reference resistance (R0), do an R0 calibration in clean air and give an honest answer to the most common question: does the MQ-135 really measure CO2? Finally, we'll run a ventilation fan automatically, log readings with an ESP32 to a time-stamped file, write MicroPython code for the Raspberry Pi Pico and compare the MQ-135 with the CCS811 and NDIR CO2 sensors.
What is the MQ-135 and how does it work?
Behind the stainless-steel mesh, the surface of a small ceramic tube is coated with tin dioxide (SnO2), and a heater wire running through it heats this layer to a few hundred degrees Celsius. In clean air, oxygen molecules cling to the SnO2 surface, trap free electrons in the material and the layer's resistance stays high. When a reducing gas such as ammonia, alcohol or benzene enters the air, it reacts with the oxygen on the surface, the electrons are released and the resistance drops. The denser the gas, the lower the resistance. The module puts this resistance in a voltage divider with a load resistor, so the voltage on the AO pin rises as the gas increases.
| Feature | Value |
|---|---|
| Sensing material | Tin dioxide (SnO2), heated ceramic tube |
| Heater voltage | 5 V ± 0.1 V |
| Heater resistance and current | 33 Ω ± 5%, about 150 mA |
| Heater power | Up to 800 mW |
| Detection range | NH3 10–300 ppm, benzene 10–1000 ppm, alcohol 10–300 ppm |
| Initial preheat | More than 24 hours |
| Operating conditions | −10 to 45 °C, relative humidity below 95% |
| Module outputs | AO (analog) and DO (digital threshold via LM393) |
Which gases does the MQ-135 detect?
The MQ-135 is not a selective sensor that measures one gas; it reacts at the same time to many gases that react with the heated SnO2 surface and can't tell them apart. The manufacturer describes it as especially sensitive to ammonia, sulphur compounds and benzene-type vapours; it also responds clearly to alcohol, smoke and nitrogen oxides. That's why it's best to think of the MQ-135 as an "air pollution indicator": when the value goes up it tells you something in the air has changed, but not what. For natural gas and LPG leaks, the MQ-2 gas sensor, designed for that job, is a much better fit.
| Gas | Where does it come from at home? | MQ-135 response |
|---|---|---|
| Ammonia (NH3) | Cleaning products, cat litter, fertiliser | High |
| Benzene, toluene and solvents | Paint, thinner, glue, cigarette smoke | High |
| Alcohol vapour | Hand sanitiser, cologne, perfume | High |
| Smoke | Cooking, cigarettes, candles | Medium |
| Nitrogen oxides (NOx) | Gas stove, exhaust fumes | Medium |
| Carbon dioxide (CO2) | Human breath, closed and crowded rooms | Weak, indirect |
Does the MQ-135 measure CO2?
The short answer: no, not really; it estimates it. The MQ-135 datasheet includes a CO2 curve, and most libraries online calculate a "CO2 ppm" value from it. But CO2 is a chemically stable gas and reacts only very weakly with the SnO2 surface. In a closed room, as people breathe, humidity and the volatile organic compounds given off by the body rise along with CO2, and those are what the MQ-135 really reacts to. So the "CO2" the sensor shows is actually an estimate based on the room's overall air pollution. The easiest proof: open a bottle of cologne next to it and watch the "CO2" value shoot up to 5000 ppm.
That doesn't mean the MQ-135 is useless. It works very well for relative decisions like "the room is getting stuffy, open the window" or "there's smoke in the kitchen, turn on the extractor". If you need the real CO2 value in a classroom, office or bedroom, though, you should use one of the NDIR CO2 sensors from the comparison at the end of this guide. The table below sums up what the readings of a real CO2 meter mean; you can interpret the MQ-135's estimates with the same ranges.
| CO2 (ppm) | What does it mean? |
|---|---|
| 400–450 | Clean outdoor air |
| 450–800 | Well-ventilated indoor space |
| 800–1000 | Acceptable, think about ventilating |
| 1000–1500 | Stuffy air, concentration may drop; ventilate |
| 1500–2000 | Headaches and drowsiness may appear |
| 5000 | 8-hour workplace exposure limit |
MQ-135 Arduino wiring
| Module pin | Arduino Uno | ESP32 | Raspberry Pi Pico |
|---|---|---|---|
| VCC (includes the heater) | 5V | VIN (5 V from USB) | VBUS (5 V from USB) |
| GND | GND | GND | GND |
| AO (analog output) | A0 | GPIO 34, through a 10 kΩ / 20 kΩ divider | GP26 (ADC0), through a 10 kΩ / 20 kΩ divider |
| DO (digital threshold, optional) | D2 | Any GPIO through a divider | Any GP pin through a divider |
Preheating: the 24–48 hour burn-in and the daily warm-up
MQ series sensors have two separate warm-ups, and people often confuse them. The first is the initial preheat (burn-in): moisture and contamination build up on the surface of a brand-new sensor or one that has sat unused in storage for a long time. The manufacturer asks for the sensor to be powered for more than 24 hours before standard measurements; in practice, running it continuously for 24–48 hours lets you watch the values drift slowly and finally settle. If you do the R0 calibration before this period is over, all your readings will drift within a few days. The second is the daily warm-up: a sensor that has completed its burn-in still needs a few minutes every time it's switched on for the heater to reach equilibrium; the values in the first minute are clearly too high or too low. That's why the code includes a wait of at least 2–3 minutes; for precise measurements, waiting 10–20 minutes is better.
Rs, RL and R0: how do you calculate ppm with the MQ-135?
Inside the module, the sensor resistance Rs and the board's load resistor RL are in series and share the 5 V. The voltage on the AO pin is Vout = 5 × RL / (Rs + RL). Turn this formula around and you get the sensor's current resistance from the voltage you measured: Rs = RL × (5 − Vout) / Vout. On the Arduino Uno, the ADC uses the same 5 V as its reference, so you don't even need to convert to volts: Rs = RL × (1023 − raw) / raw. Rs on its own isn't meaningful, because the resistance varies a lot from one sensor to the next. What matters is the ratio of Rs to its value in a known air, called R0.
The curves in the datasheet relate the Rs/R0 ratio to gas concentration and are almost straight lines on log-log axes. That means they can be expressed with a power function: ppm = A × (Rs/R0)^−B. The coefficients that popular MQ-135 libraries use for the CO2 curve are A = 116.602 and B = 2.769. To find R0, you put the sensor in clean outdoor air; since outdoor CO2 is about 420 ppm today, you turn the formula around and calculate R0 = Rs × (420 / A)^(1/B) ≈ Rs × 1.59. Remember that these coefficients are different for other gases and that the result is only an estimate.
Step-by-step MQ-135 R0 calibration
- Connect the module's VCC to 5V, GND to GND and AO to A0, and complete the initial preheat by running the sensor non-stop for 24–48 hours.
- Read the code on the load resistor on the back of the board and set RL_KOHM in the code below to match.
- Take the circuit out to clean outdoor air, such as a balcony or an open window, away from traffic, cigarettes and the kitchen.
- Upload the calibration code, open the Serial Monitor at 9600 baud and wait at least 10 minutes.
- Once the average R0 on screen hardly changes for several minutes, write it down; that is your sensor's R0.
1const byte MQ_PIN = A0;                 // MQ-135 AO
2const float RL_KOHM = 1.0;              // karttaki yük direnci: 102 = 1, 103 = 10 / load resistor on the board
3const float PARA = 116.6020682;         // CO2 eğrisi katsayıları / CO2 curve coefficients
4const float PARB = 2.769034857;
5const float CLEAN_AIR_PPM = 420.0;      // dış havadaki CO2 / CO2 in outdoor air
6
7float r0Average = 0;
8
9float readRs() {
10  long sum = 0;
11  for (int i = 0; i < 50; i++) {        // 50 ölçüm, yaklaşık 1 saniye / 50 readings, about 1 second
12    sum += analogRead(MQ_PIN);
13    delay(20);
14  }
15  float raw = sum / 50.0;
16  if (raw < 1) raw = 1;                 // sıfıra bölmeyi önle / avoid dividing by zero
17  return RL_KOHM * (1023.0 - raw) / raw;   // Rs = RL × (Vc − Vout) / Vout
18}
19
20void setup() {
21  Serial.begin(9600);
22  Serial.println(F("Temiz havada en az 10 dk bekle / wait at least 10 min in clean air"));
23}
24
25void loop() {
26  float rs = readRs();
27  float r0 = rs * pow(CLEAN_AIR_PPM / PARA, 1.0 / PARB);    // R0 = Rs × (420 / A)^(1/B)
28  if (r0Average == 0) r0Average = r0;
29  r0Average = r0Average * 0.95 + r0 * 0.05;                // yavaş ortalama / slow running average
30
31  Serial.print(F("Rs = "));
32  Serial.print(rs, 2);
33  Serial.print(F(" kOhm   R0 = "));
34  Serial.print(r0, 2);
35  Serial.print(F("   ortalama / average R0 = "));
36  Serial.println(r0Average, 2);
37}
Every second the code averages 50 readings, calculates Rs and the current R0 from them, then adds this value to a slow running average. The running average stops a brief whiff of exhaust carried by the wind from spoiling the result. The R0 you find belongs only to that sensor and that RL value; if you swap the sensor, calibrate again. Over months, as the sensor ages, R0 drifts slowly, so for projects that run for a long time it's a good habit to repeat the calibration every few months.
Measurement code: estimated ppm and air quality level
Once you've found R0, you put it into the measurement code. The code first waits 3 minutes for the warm-up, then every 2 seconds prints the Rs/R0 ratio, the estimated ppm and an air quality label based on the table above to the Serial Monitor. In clean air the ratio is around 0.6; the smaller it gets, the more gas there is in the air. To test it, put a few drops of cologne on a cotton ball near the sensor: within seconds the ratio drops and the ppm rises, and when you take the cotton away the values return to normal within a few minutes.
1const byte MQ_PIN = A0;
2const float RL_KOHM = 1.0;              // kalibrasyondaki RL ile aynı / same RL as in calibration
3const float R0_KOHM = 3.6;              // kendi kalibrasyon sonucunla değiştir / replace with your calibration result
4const float PARA = 116.6020682;
5const float PARB = 2.769034857;
6const unsigned long WARMUP_MS = 180000; // 3 dk ısınma / 3 min warm-up
7
8float readRs() {
9  long sum = 0;
10  for (int i = 0; i < 20; i++) {
11    sum += analogRead(MQ_PIN);
12    delay(10);
13  }
14  float raw = sum / 20.0;
15  if (raw < 1) raw = 1;
16  return RL_KOHM * (1023.0 - raw) / raw;
17}
18
19const __FlashStringHelper* airLabel(float ppm) {
20  if (ppm < 800)  return F("Iyi / good");
21  if (ppm < 1000) return F("Orta / moderate");
22  if (ppm < 1500) return F("Havalandir / ventilate");
23  return F("Kotu / poor");
24}
25
26void setup() {
27  Serial.begin(9600);
28  Serial.println(F("Isiniyor / warming up..."));
29  while (millis() < WARMUP_MS) delay(100);
30}
31
32void loop() {
33  float ratio = readRs() / R0_KOHM;           // gaz arttıkça küçülür / falls as gas rises
34  float ppm = PARA * pow(ratio, -PARB);       // tahmini CO2 eşdeğeri / estimated CO2 equivalent
35
36  Serial.print(F("Rs/R0 = "));
37  Serial.print(ratio, 2);
38  Serial.print(F("   ~"));
39  Serial.print(ppm, 0);
40  Serial.print(F(" ppm   "));
41  Serial.println(airLabel(ppm));
42  delay(2000);
43}
How do temperature and humidity affect the MQ-135?
The resistance of metal-oxide sensors depends not only on gas but also on room temperature and humidity. According to the datasheet curve, in the same air the Rs/R0 ratio falls noticeably when the temperature rises from 20 °C to 40 °C, and it also falls as humidity increases; the sensor reads this as "more gas". The result is ppm values that climb by themselves in a room that gets afternoon sun or in a bathroom after a shower. There are two ways to reduce this: calibrate at a temperature and humidity close to where you'll use the sensor, or measure temperature and humidity with a DHT22 or DHT11 and apply the correction formula from the libraries. Functions like getCorrectedPPM(temperature, humidity) in ready-made MQ135 libraries do exactly that. If you want to measure temperature and humidity more accurately than a DHT11 does, you can use a BME280 sensor.
Automating a ventilation fan
The MQ-135's most useful job is switching on a fan or extractor by itself when the air gets stale. Two details matter here. The first is hysteresis: the fan switches on above 1000 ppm but only switches off once the value drops below 800 ppm; with a single threshold, the relay would click every second while the value wobbles around it. The second is a minimum run time: once the fan is on, it runs for at least 2 minutes so the air in the room really gets replaced. The code also smooths the readings so that momentary spikes don't trigger the fan.
1const byte MQ_PIN = A0;
2const byte FAN_PIN = 7;                    // röle modülü IN / relay module IN
3const bool RELAY_ACTIVE_LOW = true;        // çoğu modül LOW ile çeker / most modules switch on with LOW
4const float RL_KOHM = 1.0;
5const float R0_KOHM = 3.6;                 // kendi kalibrasyon sonucun / your calibration result
6const float PARA = 116.6020682;
7const float PARB = 2.769034857;
8const float FAN_ON_PPM = 1000;             // bunun üstünde fanı aç / fan on above this
9const float FAN_OFF_PPM = 800;             // bunun altında fanı kapat / fan off below this
10const unsigned long MIN_RUN_MS = 120000;   // fan en az 2 dk çalışır / fan runs at least 2 min
11const unsigned long WARMUP_MS = 180000;    // 3 dk ısınma / 3 min warm-up
12
13bool fanOn = false;
14unsigned long fanStart = 0;
15float smoothPpm = 0;
16
17void setFan(bool on) {
18  fanOn = on;
19  if (on) fanStart = millis();
20  bool level = RELAY_ACTIVE_LOW ? !on : on;
21  digitalWrite(FAN_PIN, level ? HIGH : LOW);
22}
23
24float readPpm() {
25  long sum = 0;
26  for (int i = 0; i < 20; i++) {
27    sum += analogRead(MQ_PIN);
28    delay(10);
29  }
30  float raw = sum / 20.0;
31  if (raw < 1) raw = 1;
32  float rs = RL_KOHM * (1023.0 - raw) / raw;
33  return PARA * pow(rs / R0_KOHM, -PARB);
34}
35
36void setup() {
37  digitalWrite(FAN_PIN, RELAY_ACTIVE_LOW ? HIGH : LOW);   // önce kapalı seviye, sonra çıkış / off level first, then output
38  pinMode(FAN_PIN, OUTPUT);
39  Serial.begin(9600);
40  while (millis() < WARMUP_MS) delay(100);
41  smoothPpm = readPpm();
42}
43
44void loop() {
45  smoothPpm = smoothPpm * 0.8 + readPpm() * 0.2;          // ani sıçramaları yumuşat / smooth out spikes
46
47  if (!fanOn && smoothPpm > FAN_ON_PPM) {
48    setFan(true);
49  } else if (fanOn && smoothPpm < FAN_OFF_PPM && millis() - fanStart > MIN_RUN_MS) {
50    setFan(false);
51  }
52
53  Serial.print(F("~"));
54  Serial.print(smoothPpm, 0);
55  Serial.print(F(" ppm   fan: "));
56  Serial.println(fanOn ? F("ACIK / ON") : F("KAPALI / OFF"));
57  delay(1000);
58}
The relay module's IN pin goes to D7 and its VCC and GND to the Arduino; the fan connects to its own supply through the relay's COM and NO terminals. If you use a 12 V computer fan, a MOSFET is quieter and lasts longer than a relay; the wiring is the same as in the mini water pump circuit. If you're switching a 230 V device like a bathroom extractor fan, follow the safety rules in the relay module guide to the letter: put the mains side in a closed box and never touch the circuit while it's live. Setting the pin to the off level first and only then making it an output in setup() stops active-LOW relays from clicking on for an instant at power-up.
Logging air quality with an ESP32
Seeing how air quality changes over the day teaches you far more than a single reading: only a log reveals the stale air building up in the bedroom by morning, the spike in the kitchen while cooking or the effect of opening a window. The ESP32 code below takes a reading every minute, fetches the time from the internet (NTP) to put a date and time on each line, and saves the result as CSV to the LittleFS file system in the ESP32's own flash memory. When you open the ESP32's IP address in a browser, you see the latest reading and can download the whole log in one click as a CSV file that opens in Excel. No extra library is needed.
1#include <WiFi.h>
2#include <WebServer.h>
3#include <LittleFS.h>
4#include <time.h>
5
6const char* WIFI_SSID = "AgAdi";              // Wi-Fi adın / your Wi-Fi name
7const char* WIFI_PASS = "Sifre123";           // Wi-Fi şifren / your Wi-Fi password
8const int MQ_PIN = 34;                        // AO, 10k/20k bölücü üzerinden (ADC1) / through a 10k/20k divider (ADC1)
9const float DIVIDER = 1.5;                    // (10k + 20k) / 20k
10const float RL_KOHM = 1.0;
11const float R0_KOHM = 3.6;                    // ESP32 ile yeniden kalibre et / recalibrate with the ESP32
12const float PARA = 116.6020682;
13const float PARB = 2.769034857;
14const unsigned long LOG_INTERVAL = 60000;     // dakikada bir kayıt / one entry per minute
15
16WebServer server(80);
17unsigned long lastLog = 0;
18float lastPpm = 0;
19
20float readPpm() {
21  uint32_t mv = 0;
22  for (int i = 0; i < 20; i++) {
23    mv += analogReadMilliVolts(MQ_PIN);       // kalibre edilmiş mV / calibrated mV
24    delay(5);
25  }
26  float vout = (mv / 20.0) / 1000.0 * DIVIDER;   // sensör çıkışı (V) / sensor output (V)
27  if (vout < 0.05) vout = 0.05;
28  float rs = RL_KOHM * (5.0 - vout) / vout;
29  return PARA * pow(rs / R0_KOHM, -PARB);
30}
31
32void handleRoot() {
33  String html = "<!DOCTYPE html><html><head><meta charset='utf-8'>"
34                "<meta name='viewport' content='width=device-width,initial-scale=1'></head>"
35                "<body style='font-family:sans-serif'><h2>MQ-135</h2><p>Son ölçüm / last reading: ~";
36  html += String(lastPpm, 0);
37  html += " ppm</p><p><a href='/log.csv'>CSV indir / download</a> | "
38          "<a href='/clear'>Kaydı sil / clear log</a></p></body></html>";
39  server.send(200, "text/html", html);
40}
41
42void handleCsv() {
43  File f = LittleFS.open("/log.csv", "r");
44  if (!f) {
45    server.send(404, "text/plain", "Kayit yok / no log yet");
46    return;
47  }
48  server.streamFile(f, "text/csv");
49  f.close();
50}
51
52void handleClear() {
53  LittleFS.remove("/log.csv");
54  server.sendHeader("Location", "/");
55  server.send(303);
56}
57
58void setup() {
59  Serial.begin(115200);
60  analogSetPinAttenuation(MQ_PIN, ADC_11db);  // yaklaşık 0-3,1 V ölçüm aralığı / about 0-3.1 V range
61  if (!LittleFS.begin(true)) {                // true: ilk açılışta biçimlendir / format on first use
62    Serial.println("LittleFS hatasi / error");
63  }
64  WiFi.mode(WIFI_STA);
65  WiFi.begin(WIFI_SSID, WIFI_PASS);
66  while (WiFi.status() != WL_CONNECTED) {
67    delay(500);
68    Serial.print(".");
69  }
70  Serial.println();
71  Serial.println(WiFi.localIP());
72  configTime(3 * 3600, 0, "pool.ntp.org");    // UTC+3; kendi saat dilimine göre değiştir / change to your time zone
73
74  server.on("/", handleRoot);
75  server.on("/log.csv", handleCsv);
76  server.on("/clear", handleClear);
77  server.begin();
78  lastLog = millis();                         // ilk kayıt 1 dk sonra, sensör ısınırken / first entry after 1 min
79}
80
81void loop() {
82  server.handleClient();
83  if (millis() - lastLog >= LOG_INTERVAL) {
84    lastLog = millis();
85    lastPpm = readPpm();
86    char stamp[20] = "saat-yok";
87    struct tm now;
88    if (getLocalTime(&now, 100)) {
89      strftime(stamp, sizeof(stamp), "%Y-%m-%d %H:%M", &now);
90    }
91    File f = LittleFS.open("/log.csv", "a");  // dosyanın sonuna ekle / append to the file
92    if (f) {
93      f.printf("%s,%.0f\n", stamp, lastPpm);
94      f.close();
95    }
96    Serial.printf("%s  ~%.0f ppm\n", stamp, lastPpm);
97  }
98}
Because the ESP32's ADC measures differently from the Uno's, it's best to redo the R0 calibration with this circuit; just adapt the readRs() function in the calibration code using the logic of readPpm() here. Connect the sensor to one of the ADC1 pins between GPIO 32 and 39: ADC2 pins can't be used while Wi-Fi is on. Each line is about 22 bytes; with one entry per minute, about 32 KB of data builds up per day, and the 1.5 MB area in the default partition scheme lasts roughly a month and a half. For longer logs you can use an SD card module, and if you want to send the data straight to a spreadsheet, look at the ESP32 with Google Sheets method.
MQ-135 with the Raspberry Pi Pico (MicroPython)
On the Pico you power the module with 5 V from the VBUS pin and connect the AO output to GP26, again through a 10 kΩ / 20 kΩ divider. The Pico's ADC returns a 16-bit value (0–65535) referenced to 3.3 V; the code converts it first to a voltage and then, using the divider ratio, to the sensor output. The formula is the same as on the Arduino. Since VBUS can vary between 4.8 and 5.1 V depending on the USB source, for precise results measure VBUS with a multimeter and correct the 5.0 in the code.
1from machine import ADC
2import time
3
4adc = ADC(26)                          # GP26 = ADC0, AO bölücü üzerinden / AO through a divider
5DIVIDER = 1.5                          # (10k + 20k) / 20k
6RL = 1.0                               # kΩ, karttaki yük direnci / load resistor on the board
7R0 = 3.6                               # kΩ, kendi kalibrasyon sonucun / your calibration result
8PARA, PARB = 116.6020682, 2.769034857
9VCC = 5.0                              # VBUS gerilimi / VBUS voltage
10
11def read_rs():
12    total = 0
13    for _ in range(20):
14        total += adc.read_u16()
15        time.sleep_ms(5)
16    v = total / 20 / 65535 * 3.3 * DIVIDER    # sensör çıkışı (V) / sensor output (V)
17    v = max(v, 0.05)                          # sıfıra bölmeyi önle / avoid dividing by zero
18    return RL * (VCC - v) / v
19
20print("Isiniyor / warming up...")
21time.sleep(180)                        # 3 dk ısınma / 3 min warm-up
22while True:
23    ratio = read_rs() / R0
24    ppm = PARA * ratio ** -PARB        # tahmini CO2 eşdeğeri / estimated CO2 equivalent
25    print("Rs/R0 = %.2f   ~%d ppm" % (ratio, ppm))
26    time.sleep(2)
MQ-135 vs CCS811 vs NDIR CO2 sensors
There are three classes of air quality sensor, and each one answers a different question. The MQ-135 is cheap, analog and simple; it shows general changes in the air. The CCS811 is also a metal-oxide sensor, but it has its own microcontroller inside, manages the heater itself and outputs TVOC (total volatile organic compounds) and eCO2 (equivalent CO2) directly over I2C; we cover it in the CCS811 air quality sensor guide. The only group that measures real CO2 is NDIR (non-dispersive infrared) sensors: modules like the MH-Z19B or SenseAir S8 measure how much infrared light at 4.26 µm is absorbed by CO2 molecules and are barely affected by other gases.
| Feature | MQ-135 | CCS811 | NDIR (MH-Z19B, SenseAir S8) |
|---|---|---|---|
| Measuring principle | Resistance of heated SnO2 | Metal oxide + built-in microcontroller | Infrared light absorption |
| Measures real CO2? | No, it estimates | No, calculates eCO2 from VOCs | Yes |
| Output | Analog (plus digital threshold) | I2C | UART or PWM |
| Supply | 5 V, about 150 mA | 3.3 V, about 30 mA on average | 5 V, under 60 mA on average |
| Warm-up | 24–48 h when new, then a few minutes | 48 h when new, then 20 minutes | About 3 minutes |
| Accuracy | Low, for relative changes | Medium, for relative VOC tracking | About ±50 ppm + 3–5% of reading |
| Price | Cheapest | Medium | Most expensive |
In short: for learning, triggering an alarm or fan and watching changes in the air, the MQ-135 is enough. If you want to track paint, glue or cleaning product vapours, the CCS811 gives smoother, more stable data. If you need a reliable number to answer "is it time to open the window?" in a classroom, office or bedroom, you'll have to invest in an NDIR CO2 sensor. Many people use both: the NDIR sensor tracks CO2 while the MQ-135 catches sudden events like smoke or solvent smells in the kitchen.
Project ideas with the MQ-135
- Room air indicator: An RGB LED that glows green, yellow or red depending on air quality, or a live graph on an OLED display.
- Smart kitchen extractor: A system that switches the extractor on when smoke and steam rise during cooking and off once the air is clean.
- Garage and paint workshop warning: A circuit that sounds a buzzer and starts ventilation when solvent vapour rises.
- Cat litter monitor: An ESP32 project that notifies your phone when ammonia rises and it's time to change the litter.
- Classroom air board: A graph that logs readings with an ESP32 and compares them with lesson times to show ventilation habits.
- Home automation: Send the values to Home Assistant over MQTT and switch on an air purifier with a smart plug when the air gets worse.
Common mistakes and how to fix them
| Symptom | Likely cause | Fix |
|---|---|---|
| Values keep drifting for hours | Initial preheat not finished | Run the sensor non-stop for 24–48 hours, then calibrate |
| Values far too high or low at power-up | No daily warm-up wait | Wait at least 3 minutes, ideally 10–20, before measuring |
| Thousands of ppm even in clean air | Wrong R0, or calibration done indoors | Repeat the calibration in clean outdoor air |
| On the ESP32 the values are always maxed out | AO reaches 5 V, or the sensor runs on 3.3 V | Power the sensor from 5 V and add a 10k/20k divider on AO |
| The Arduino gets warm or USB disconnects | The 150 mA heater plus other loads strain the USB | Use an external 5 V supply and join the grounds |
| ppm rises in sunlight or after a shower | Temperature and humidity effect | Calibrate in similar conditions or apply DHT22 correction |
As long as you know its limits, the MQ-135 is an excellent starter sensor for learning about air quality and automating ventilation: power it from 5 V, give it 24–48 hours of preheat, find R0 in clean air, read the results relatively and move to an NDIR sensor when you need real CO2. In the BlueGrays app you'll find the Gas Sensor, Flame and Gas Sensor Alarm and ESP32 MQ-2 Gas Detector projects, together with DHT11 and DHT22 temperature–humidity and ESP32 temperature logger projects, with step-by-step circuit diagrams and code.
Frequently asked questions
Can the MQ135 measure CO2?
The MQ-135 doesn't truly measure CO2; it estimates it. The sensor responds only weakly to CO2; its real response is to gases such as alcohol, ammonia and benzene and to the volatile compounds people give off. The CO2 ppm value that libraries show is calculated from this general pollution; for real CO2 you need an NDIR sensor such as the MH-Z19B.
How long does the MQ135 take to warm up?
A new MQ-135 needs an initial preheat of 24–48 hours, and this must be completed before calibration. After that, the sensor becomes usable within about 2–3 minutes each time it's switched on; for the most stable values, waiting 10–20 minutes is better.
How do you find the R0 value of the MQ135?
Take a sensor that has completed its preheat into clean outdoor air, calculate its resistance with Rs = RL × (1023 − raw) / raw and, assuming outdoor CO2 is about 420 ppm, compute R0 = Rs × (420 / 116.6)^(1 / 2.769). Average several minutes of readings. The R0 you find belongs only to that sensor and that load resistor.
What is the difference between the MQ135 and the MQ2?
Both are heated metal-oxide sensors, but they're tuned to different gases. The MQ-2 suits LPG, propane, methane, hydrogen and smoke, so it's the one for gas leak alarms. The MQ-135 is sensitive to air pollutants such as ammonia, benzene, alcohol, NOx and smoke, and is used to monitor air quality.
Can the MQ135 be used with an ESP32?
Yes, but watch two things. The sensor's heater needs 5 V, so power the module from the ESP32's VIN pin. The AO output can also reach 5 V, so bring it down to 3.3 V with a 10 kΩ and 20 kΩ voltage divider and connect it to an ADC1 pin between GPIO 32 and 39.
Which gases does the MQ135 detect?
The MQ-135 is most sensitive to ammonia, sulphur compounds and aromatic vapours like benzene. It also responds clearly to alcohol, smoke and nitrogen oxides, and weakly to CO2 and carbon monoxide. It can't tell these gases apart; it only shows the overall change in the air.
Projects to build after reading this
See all projects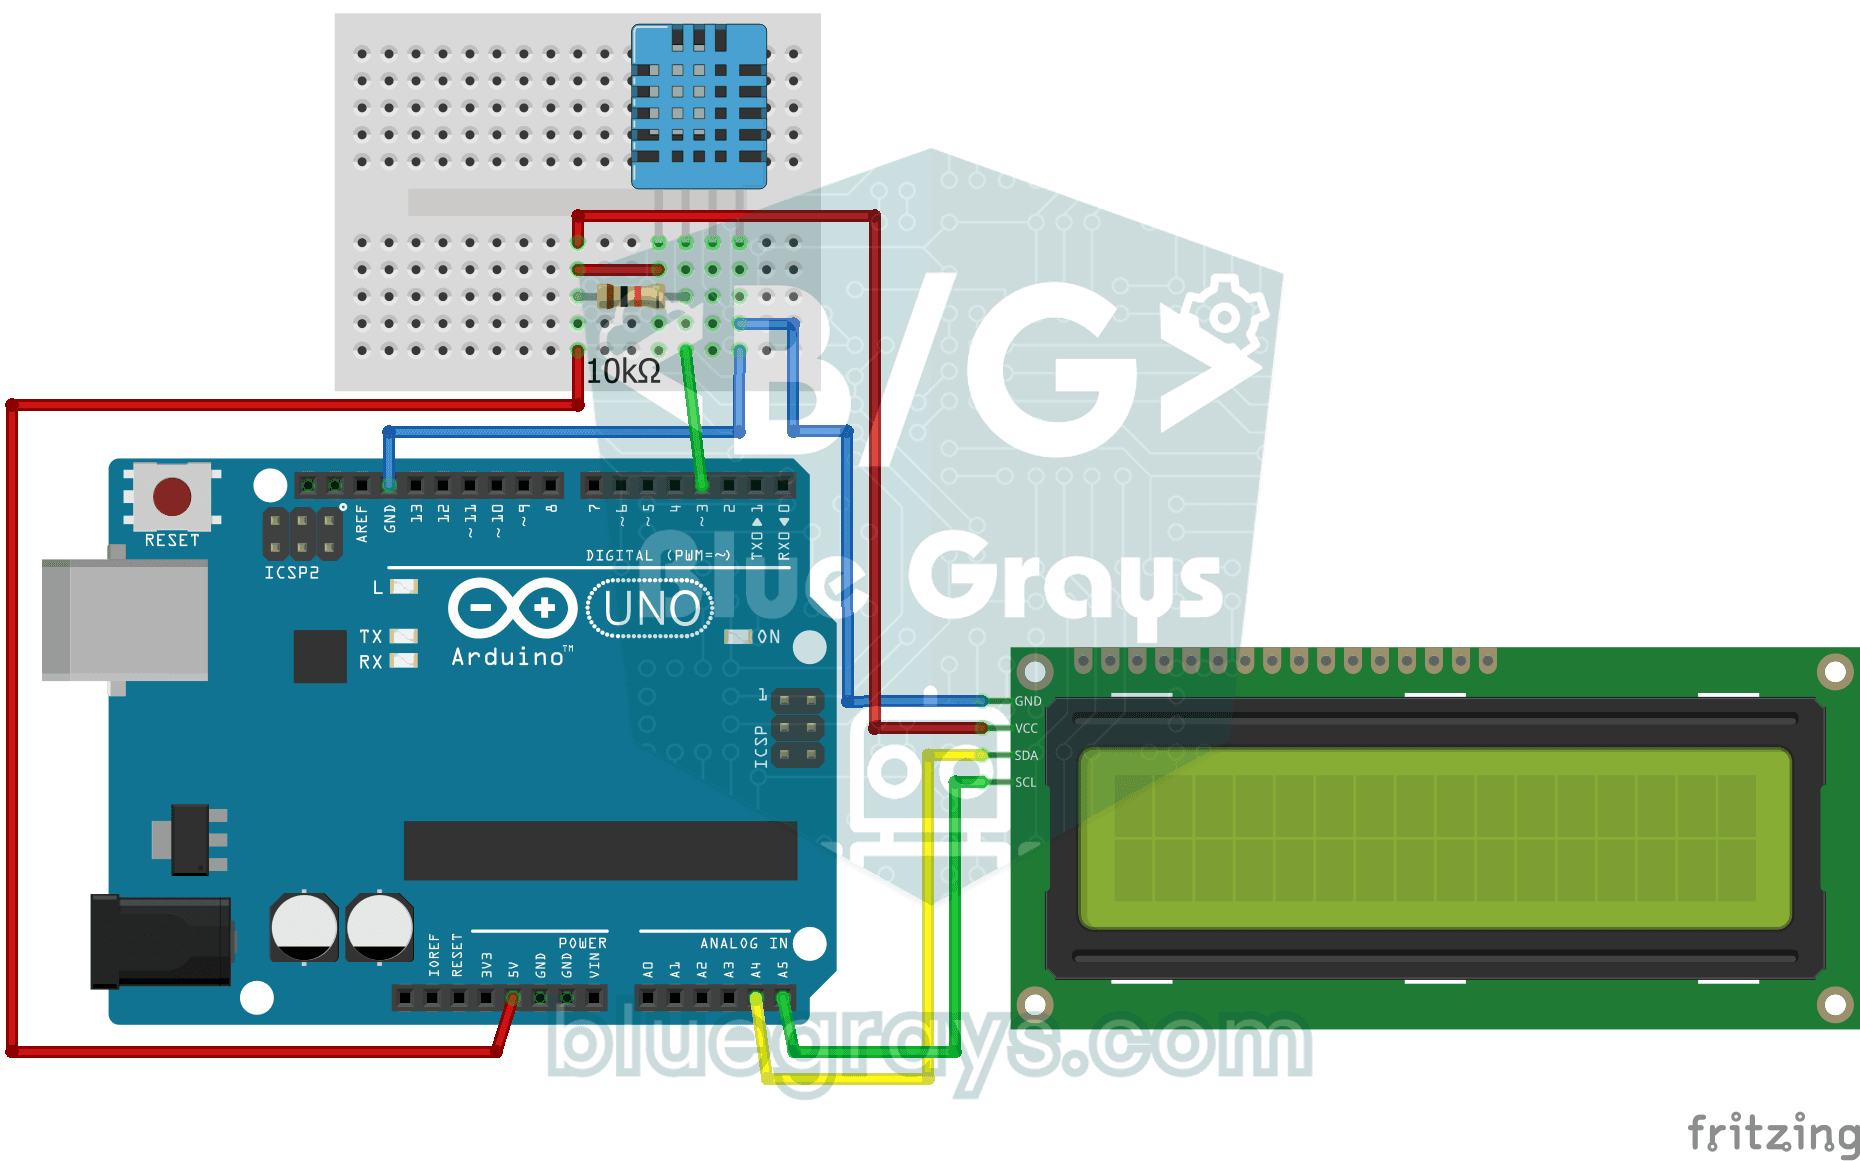
Temperature and Humidity with DHT11
How warm is your room, and is the air humid or dry? The DHT11 sensor measures temperature and humidity, and the Arduino writes the values on a two-line LCD screen, refreshing every couple of seconds.
Using a Gas Sensor
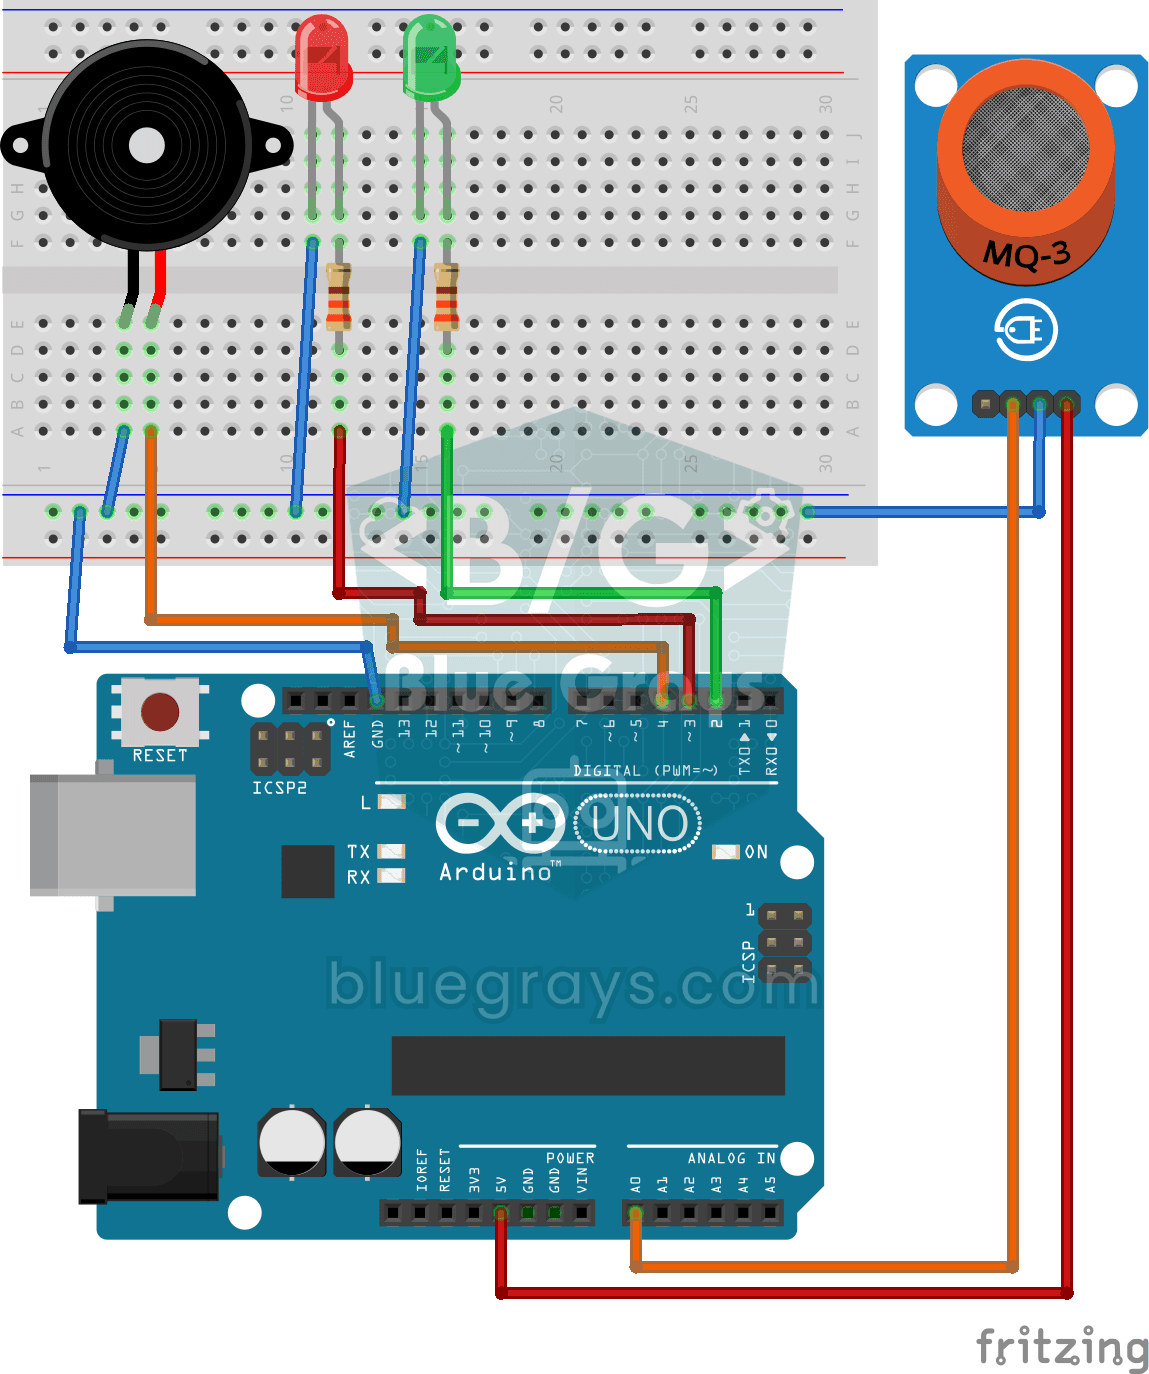
A little guard that notices a gas leak in the kitchen before you do. The gas sensor keeps sniffing the air; while everything is fine the green LED stays on, and when the gas in the air passes a certai
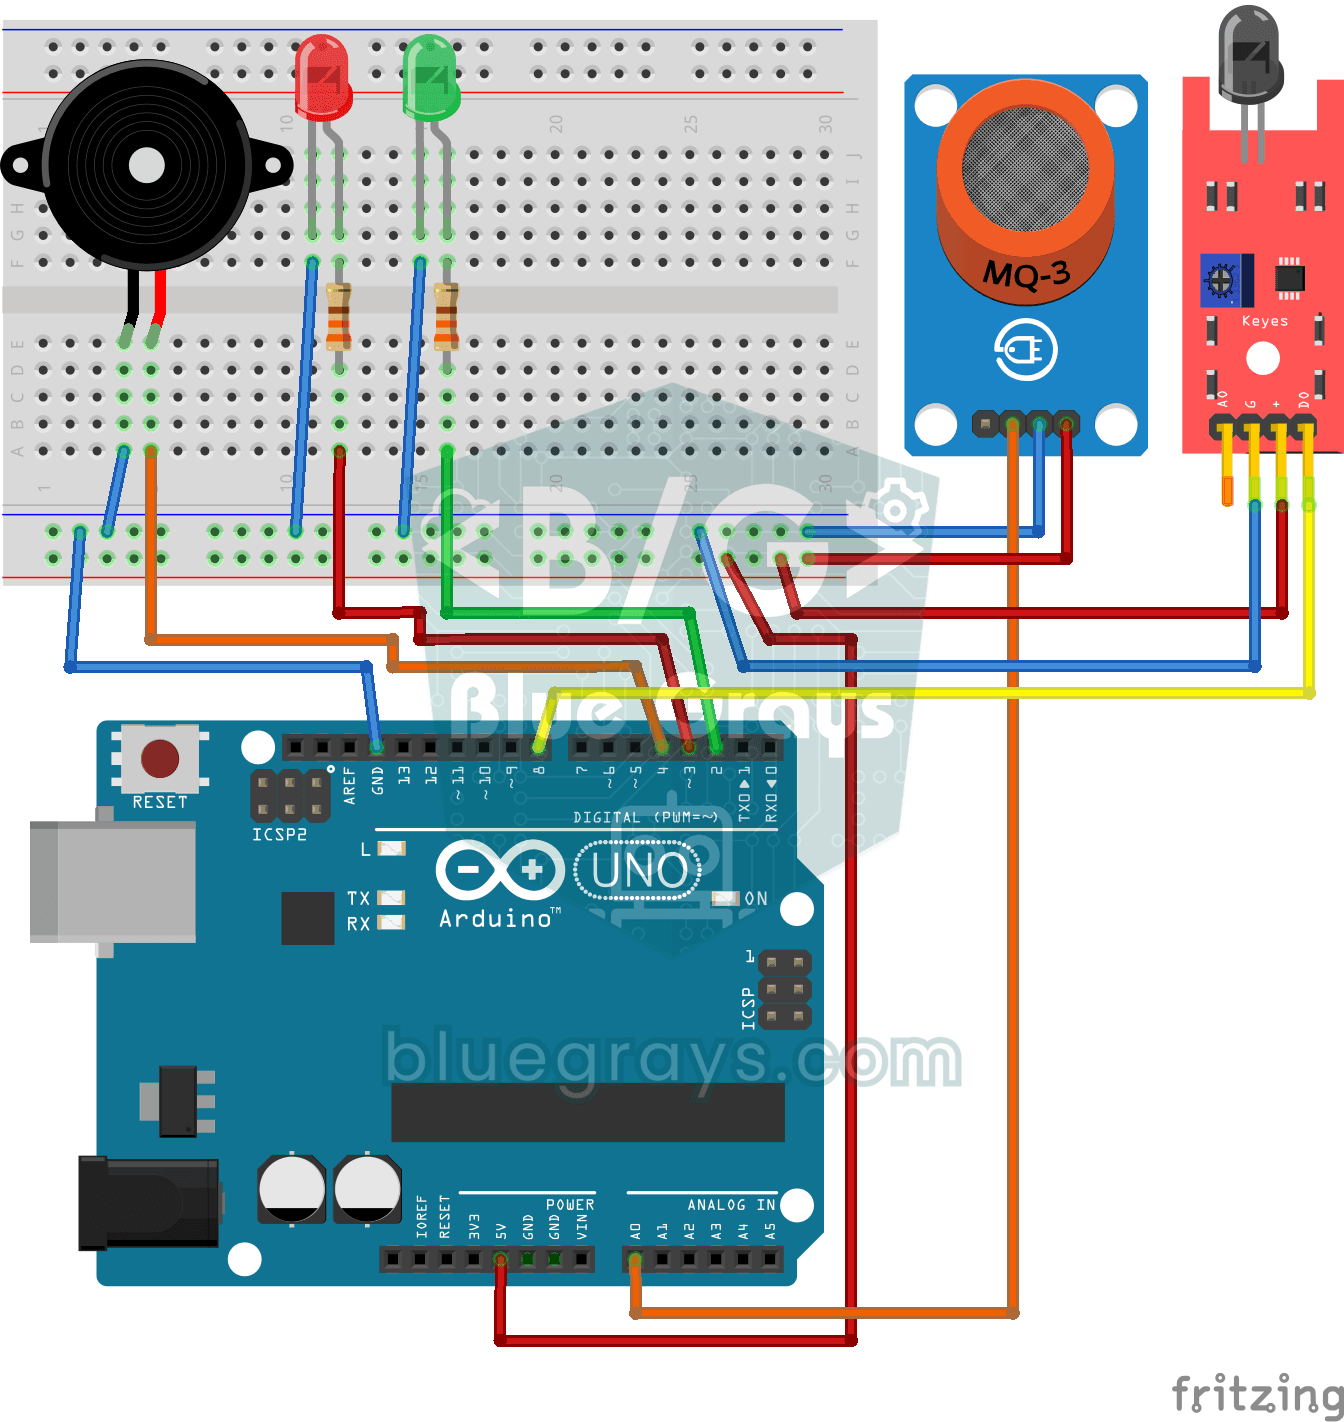
Flame and Gas Sensor Alarm
A little guard that warns you right away when gas leaks or a flame appears somewhere. The gas sensor watches the air for gas and the flame sensor watches for the light of a fire; while everything is f

ESP32 MQ-2 Gas/Smoke Detector Alarm
In this project, combustible gas (LPG, methane, propane) and smoke detection is performed using an MQ-2 gas sensor module, and a siren-like alarm is played through a passive buzzer upon detection. The sensor's digital threshold output (DO) is connected to GPIO 4 on the ESP32; when gas or smoke exceeds the threshold, DO goes LOW and the alarm is triggered. Sensitivity is adjusted via the module's potentiometer. The passive buzzer is driven using tone() to produce a two-frequency siren effect.

ESP32 DHT22 Temperature and Humidity (with LCD Display)
This project measures ambient temperature and humidity using a DHT22 sensor and displays the data in real time on a 16x2 I2C LCD. Data is read from the sensor using the one-wire protocol via the Adafruit DHT library. This project serves as the foundation for IoT weather stations, smart home automation, or environmental monitoring systems in greenhouses. Communication with the DHT22 is established via the ESP32's GPIO 4 pin.
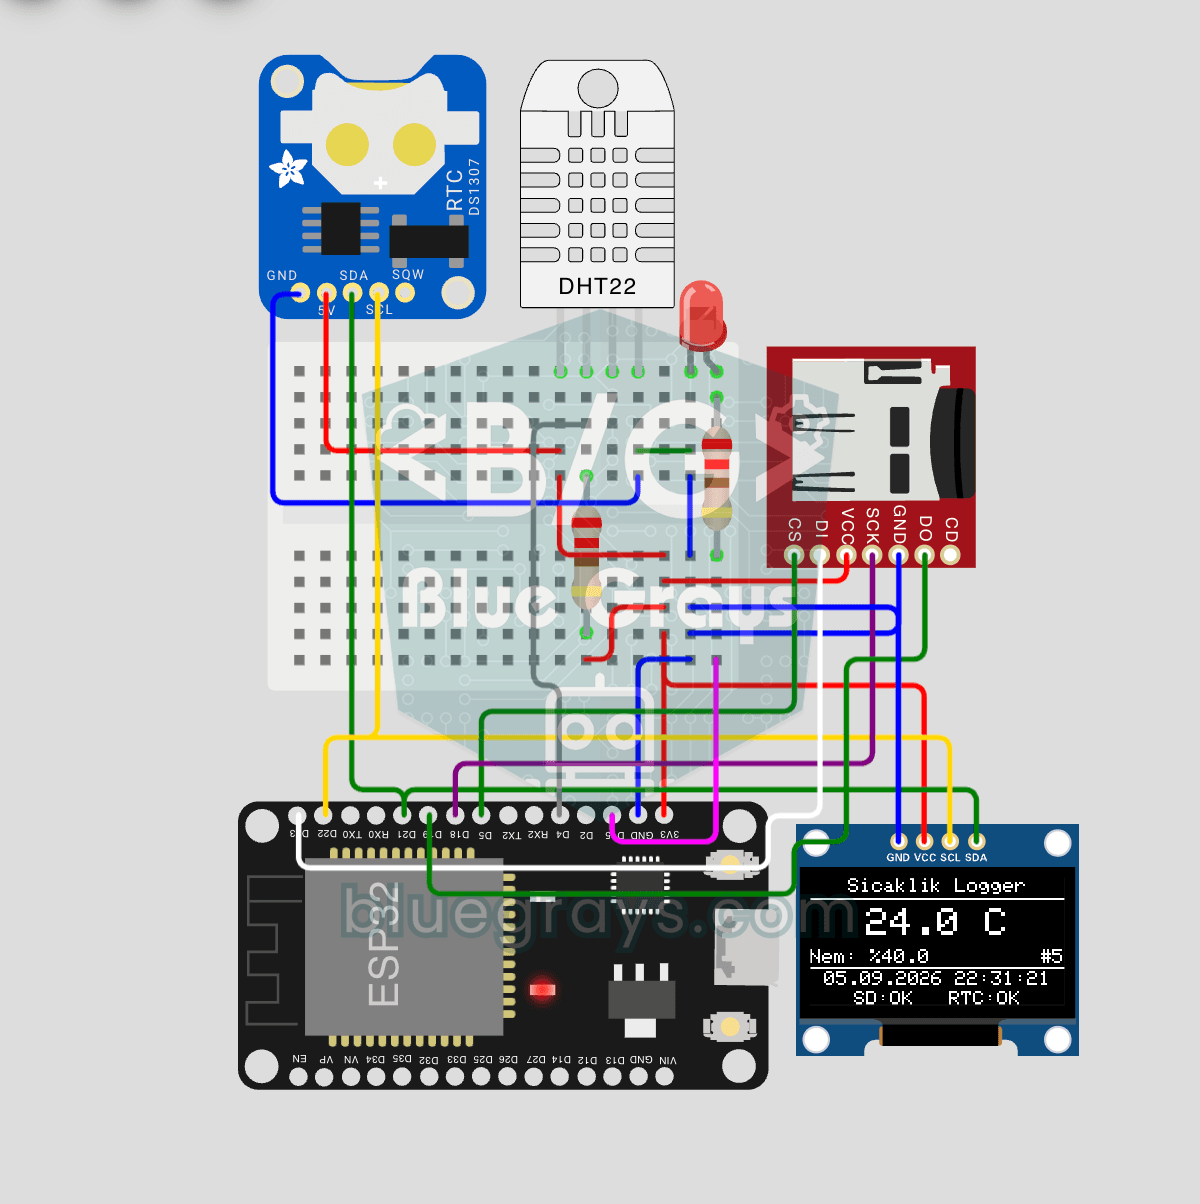
ESP32 Temperature Data Logger (DHT22 + DS1307 RTC + microSD + OLED)
Build a timestamped temperature logger with ESP32! Read DHT22 temperature/humidity every minute, get real-world time from DS1307 RTC, and log to microSD card as CSV. The OLED displays live temperature (large font), humidity percentage, timestamp, and log counter. The /temp_log.csv file on the SD card opens in Excel, Google Sheets, or Python pandas for analysis — perfect for greenhouse monitoring, home/room temperature tracking, laboratory data collection, food storage conditions, or beehiv

ESP32 I2C LCD Display (16x2)
In this project, we display text by connecting a 16x2 character LCD screen to the ESP32 via the I2C protocol. Thanks to I2C, we can control the screen using just two data pins (SDA and SCL), eliminating the waste of 6+ pins associated with a classic parallel connection. The code prints a fixed message on the first line and a counter that increments every second on the second line. Additionally, we run an I2C scanner at the start to print the display’s address to the Serial Monitor (typically 0x2
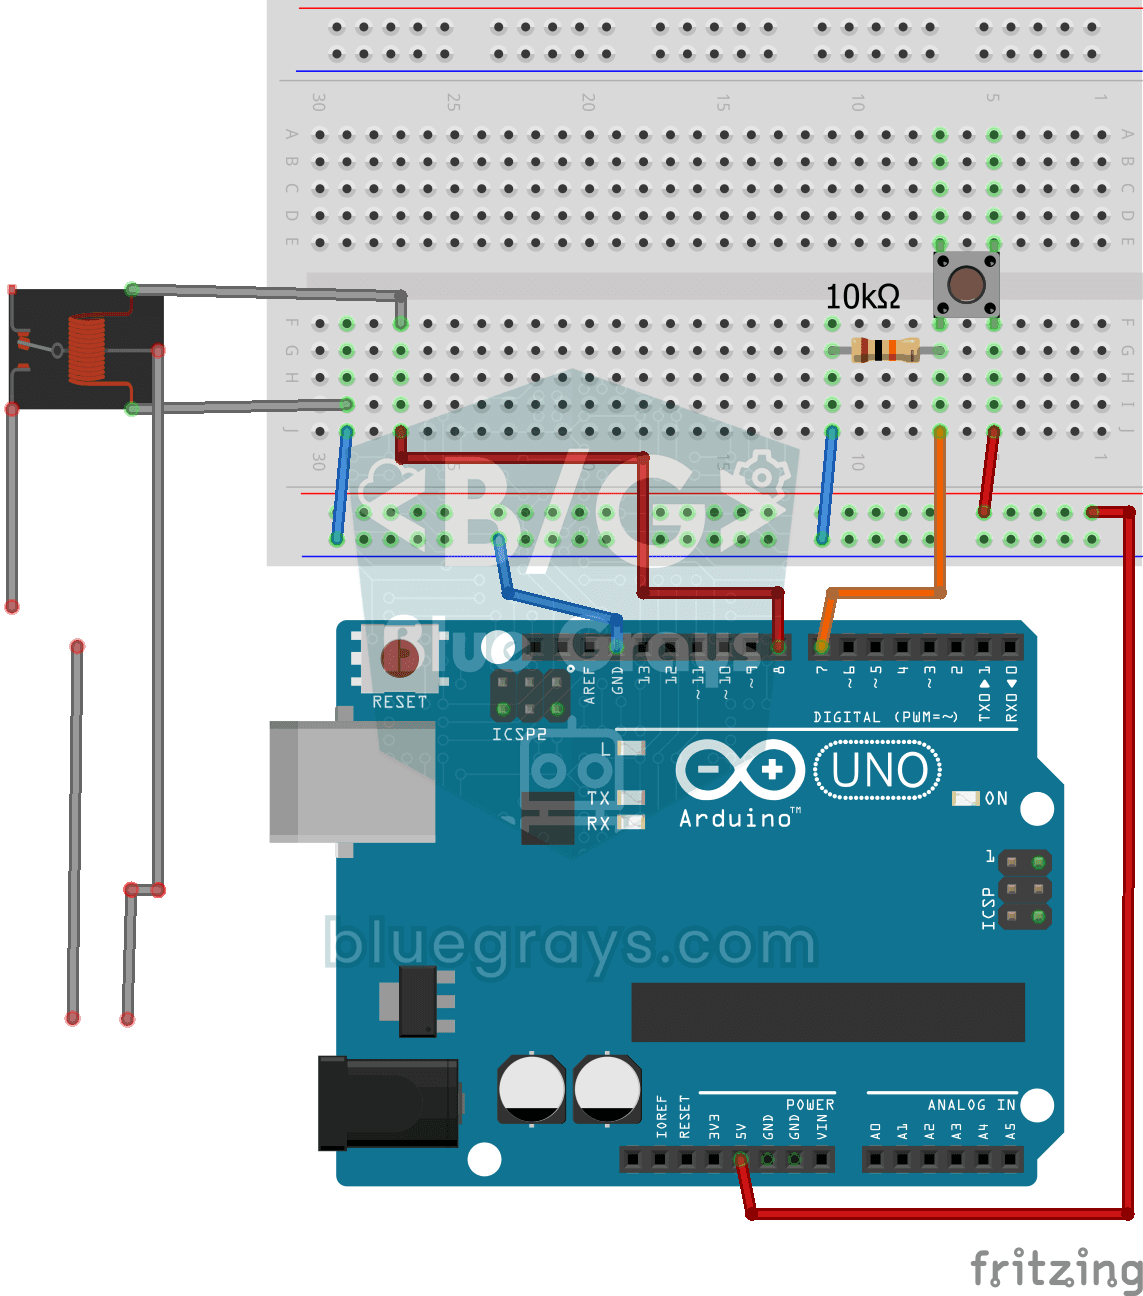
Lighting 220V Bulb with Push Button
As long as you hold the button, a real 220-volt bulb stays lit, and it goes out the moment you let go. The Arduino's tiny signal cannot light the bulb directly, so a relay, an electrically controlled