
How to Write a TÜBİTAK Project Report: Arduino Project Guide
How do you write a TÜBİTAK 2204 or 4006 project report? Aim, method, circuit diagram, code, Arduino data logging, Excel charts and APA citation examples.
The short answer to "how do I write a TÜBİTAK project report" is this: a report is a document that tells the jury, in order and with evidence, what you wondered, how you measured it, what you found and what conclusion you draw. In an Arduino-based 2204 or 4006 project, that evidence is the circuit diagram, the key parts of the code, the measurement tables collected from sensors and the charts drawn from that data. However good your setup is, any effort you can't explain in the report stays invisible in the evaluation.
In this guide we go through every section of the report (summary, aim, introduction, method, findings, conclusion, recommendations and references) with examples specific to Arduino projects. We follow a single example experiment throughout: the cooling rate of hot water in cups wrapped with different insulation materials, measured with three DS18B20 temperature sensors. You'll see step by step how to take the data from the Arduino into Excel, draw charts and cite sources correctly.
What is a TÜBİTAK project report and who reads it?
A project report is written so that an evaluator who doesn't know you and never saw your setup running can understand your project from the paper alone. In the 2204 High School Students Research Projects competition, the report is the basis of the preliminary evaluation that decides whether you're invited to the exhibition. At the 4006 Science Fairs, it helps your advisor teacher and the fair visitors understand the project. In both cases the reader looks for answers to the same questions: Is the problem real, is the method suitable for solving it, is the data reliable and are the results supported by the data? We explain the differences between the two programs in detail in the difference between TÜBİTAK 2204 and 4006.
| Feature | 2204 Research Projects | 4006 Science Fairs |
|---|---|---|
| Aim | Answering an original research question with the scientific method | Letting students experience and exhibit the scientific process |
| Evaluation | First a preliminary screening on the report, then the exhibition and finals | Exhibition at a fair held at school |
| Weight of the report | Very high; the report largely decides the screening | Medium; evaluated together with the poster and oral presentation |
| Originality expected | High; you must state clearly how you differ from similar work | Lower; taking a known experiment and applying it to your own problem is fine |
| Format rules | Detailed in the application guide (pages, font, section order) | More flexible, following the template of school and provincial coordinators |
Report sections and the right order
| Section | What you write | Example in an Arduino project |
|---|---|---|
| Title | Describes the project in one sentence, with the measured variable | Investigating the Effect of Different Insulation Materials on the Cooling Rate of Hot Water with Sensors |
| Summary and keywords | Problem, aim, method, main finding and conclusion; 3–5 keywords | Cooling rate, insulation, DS18B20, Arduino, data logging |
| Aim | A measurable goal and, if any, a hypothesis | To show that the polystyrene-wrapped cup loses the least heat in 30 minutes |
| Introduction | Importance of the topic, earlier work, what sets your project apart | Heat conduction, insulation materials, similar studies |
| Method | Materials, experimental setup, circuit diagram, measurement steps, code | 3 sensors, a 10-second measurement interval, 3 repeats |
| Work-time schedule | Which task was done in which month (if the guide asks for it) | Literature review in September, setup in October, measurements in November |
| Findings | Tables and charts; measurements without commentary | Time-temperature chart, 30th-minute table |
| Conclusion and discussion | Meaning of the findings, comparison with the hypothesis, error sources | Polystyrene gave the best insulation; changing room temperature was an error source |
| Recommendations | How the project could be improved | More materials, cups with lids, longer measurements |
| References | Every work cited in the text, in a single format | Book, article, datasheet, web page |
Title, summary and keywords
The title should say what the project measures and with what. Titles that contain the independent and dependent variables, such as "The Effect of Different Insulation Materials on the Cooling Rate of Hot Water", make the jury's job easier than a product name like "Smart Thermos". The summary is the most-read part of the report and is usually written last, because you can't write a good summary without knowing your findings. Don't use citations, tables or charts in the summary; write plain text only. The five-sentence pattern below is a good starting point for a short, complete summary:
- Sentence 1 (problem): Heat loss in homes and in transport containers wastes energy.
- Sentence 2 (aim): This project compares the effect of three different insulation conditions on the cooling rate of hot water.
- Sentence 3 (method): 200 mL of water at 70 °C was measured every 10 seconds for 30 minutes with an Arduino and three DS18B20 sensors.
- Sentence 4 (finding): After 30 minutes, the temperature dropped by 22 °C in the uninsulated cup and by 9 °C in the polystyrene-wrapped cup.
- Sentence 5 (conclusion): Polystyrene gave the most effective insulation of the materials tested, and this result did not change in any of the three repeats.
How do you write the aim and introduction?
The aim section shouldn't run beyond a paragraph or two and shouldn't leave the "The aim of this project is to examine ..." pattern vague. A good aim is measurable: it says what you measure, under what conditions and with what tool. If you have a hypothesis, state it clearly here: "It was predicted that the water in the polystyrene-wrapped cup would cool more slowly than in the uninsulated cup." In the introduction you explain why the topic matters, what has been done before and in what way your project differs from that work. Define basic concepts such as heat conduction and thermal conductivity briefly, and back every piece of information with a source. Don't spend pages explaining what an Arduino is; the jury knows that, and what matters to them is your problem and your method.
Method: materials, experimental setup and connections
The method section should be detailed enough that another student could repeat the same experiment by looking at your report. Write the model, quantity and reason for choosing each material you used; state the experimental conditions (room temperature, water volume, starting temperature, measurement interval, number of repeats) with numbers. Don't forget the control group: in our example, the uninsulated cup is the reference that the other cups are compared against. Justify your sensor choice too: according to the manufacturer's datasheet, the DS18B20 measures between -10 and +85 °C with ±0.5 °C accuracy, and several sensors can be connected to the same data line. For how the sensor works, see DS18B20 Temperature Sensor.
| Material | Qty | Feature / role |
|---|---|---|
| Arduino Uno | 1 | Measuring, timing and sending data to the computer |
| DS18B20 waterproof probe | 3 | -55…+125 °C measuring range, 0.0625 °C resolution at 12 bits |
| 4.7 kΩ resistor | 1 | Pull-up resistor for the data line |
| Glass cup (250 mL) | 3 | Same size and glass thickness |
| Aluminium foil, 1 cm polystyrene sheet | One each | Insulation materials being tested |
| Breadboard and jumper wires | 1 set | Circuit connections |
| Digital thermometer | 1 | Calibration check of the sensors |
| DS18B20 lead | Arduino Uno | ESP32 | Raspberry Pi Pico |
|---|---|---|---|
| GND (black) | GND | GND | GND |
| VDD (red) | 5V | 3V3 | 3V3(OUT) |
| DQ data (usually yellow) | D2 | GPIO 4 | GP2 |
| 4.7 kΩ pull-up | Between D2 and 5V | Between GPIO 4 and 3V3 | Between GP2 and 3V3 |
Collecting experiment data with Arduino
- Install the OneWire and DallasTemperature libraries from the Library Manager.
- Connect the three sensors to the same data line, first put them all in the same cup and measure for 5 minutes, and note the differences between them (calibration).
- Pour 200 mL of 70 °C water into the cups at the same time and fix the sensor tips so they sit in the middle of the water.
- Upload the code, open the Serial Monitor at 9600 baud and wait for 30 minutes without touching the setup.
- When the measurement ends, copy all the lines in the Serial Monitor and save them to a dated file; repeat the experiment at least three times.
1#include <OneWire.h>
2#include <DallasTemperature.h>
3
4const int VERI_PIN = 2;                  // DS18B20 veri hattı / DS18B20 data line
5const unsigned long ARALIK_MS = 10000;   // 10 saniyede bir ölçüm / one sample every 10 s
6
7OneWire oneWire(VERI_PIN);
8DallasTemperature sensorler(&oneWire);
9
10unsigned long sonOlcum = 0;
11int sensorSayisi = 0;
12
13void setup() {
14  Serial.begin(9600);
15  sensorler.begin();
16  sensorler.setResolution(12);           // 0,0625 °C çözünürlük / 0.0625 °C resolution
17  sensorSayisi = sensorler.getDeviceCount();
18
19  // CSV başlık satırı / CSV header line
20  Serial.print(F("zaman_s"));
21  for (int i = 0; i < sensorSayisi; i++) {
22    Serial.print(F(";sensor"));
23    Serial.print(i + 1);
24    Serial.print(F("_C"));
25  }
26  Serial.println();
27}
28
29void loop() {
30  if (millis() - sonOlcum >= ARALIK_MS) {
31    sonOlcum += ARALIK_MS;               // kaymasız zamanlama / drift-free timing
32    sensorler.requestTemperatures();     // tüm sensörlerde ölçümü başlat / start conversion on all sensors
33    Serial.print(sonOlcum / 1000);       // geçen süre (s) / elapsed time (s)
34    for (int i = 0; i < sensorSayisi; i++) {
35      float t = sensorler.getTempCByIndex(i);
36      Serial.print(';');
37      if (t == DEVICE_DISCONNECTED_C) {
38        Serial.print(F("HATA"));         // sensör okunamadı / sensor not read
39      } else {
40        Serial.print(t, 2);
41      }
42    }
43    Serial.println();
44  }
45}
The code first prints the column headers, then produces one line every 10 seconds: the elapsed time and each sensor's temperature, separated by semicolons. This CSV format can be pasted straight into Excel. Because millis() is used for timing instead of delay(), the measurement interval stays constant; increasing the sonOlcum variable by ARALIK_MS also prevents drift that builds up over time. At 12-bit resolution one conversion takes about 750 ms, so a 10-second interval is more than enough. The order of the sensors is determined not by wire order but by the 64-bit address inside each sensor; before you start measuring, warm the sensors one by one with your finger and note which column rises for which one. For details, see the difference between millis and delay and using the Serial Monitor.
Measuring without a computer using ESP32 and Raspberry Pi Pico
The same Arduino code works on the ESP32 simply by setting VERI_PIN to 4; thanks to the ESP32's Wi-Fi, you can also send measurements straight to an online spreadsheet (ESP32 with Google Sheets). For experiments that last hours and when you don't want to keep a computer waiting beside them, the Raspberry Pi Pico is a good choice: with MicroPython you write the measurements to a CSV file in the board's own memory and copy the file to your computer with Thonny when the experiment is over. On Arduino you can do the same job with an SD card module.
1from machine import Pin
2import onewire, ds18x20, time
3
4ow = onewire.OneWire(Pin(2))            # GP2 veri hattı / GP2 data line
5ds = ds18x20.DS18X20(ow)
6roms = ds.scan()                         # bağlı sensörleri bul / find connected sensors
7print("Bulunan sensor / sensors found:", len(roms))
8
9ARALIK = 10                              # saniye / seconds
10baslangic = time.ticks_ms()
11
12with open("veri.csv", "w") as f:         # başlık satırı / header line
13    f.write("zaman_s;" + ";".join("sensor%d_C" % (i + 1) for i in range(len(roms))) + "\n")
14
15while True:
16    ds.convert_temp()                    # ölçümü başlat / start conversion
17    time.sleep_ms(750)                   # 12 bit dönüşüm süresi / 12-bit conversion time
18    gecen = time.ticks_diff(time.ticks_ms(), baslangic) // 1000
19    degerler = ["%.2f" % ds.read_temp(r) for r in roms]
20    satir = str(gecen) + ";" + ";".join(degerler)
21    print(satir)
22    with open("veri.csv", "a") as f:     # dosyaya ekle / append to file
23        f.write(satir + "\n")
24    time.sleep(ARALIK - 0.75)
Adding the circuit diagram and photos to the report
Add the circuit diagram not as a phone photo of a breadboard but as a clean figure prepared in a drawing program. Fritzing offers both a breadboard view and a schematic drawing; Tinkercad also lets you draw and simulate the circuit. For a more professional look you can draw the schematic with EasyEDA. Give every figure a number and a descriptive caption ("Figure 3. Connection diagram of three DS18B20 sensors to the Arduino Uno") and refer to the figure by its number in the text. Add a photo of the experimental setup too, but make sure no names, school logos or faces appear in the background. If you're not familiar with schematic symbols, reading circuit diagrams is a good place to start.
How do you add code to the report?
- Don't put all the code in the body of the report; explain the algorithm in a few sentences or with a flowchart in the method section, and put the full code in the Appendices if the guide allows it.
- In the body, show only the project-specific critical part, for example the measurement loop, in 10–15 lines.
- Add the code as text in a monospaced font such as Courier New or Consolas; a screenshot can't be read at small sizes and can't be copied.
- Write the names and versions of the libraries you used; if you adapted code written by someone else, cite its source.
- Keep the comments clear; even if the jury doesn't read every line of code, they glance at the comments and ask their questions from there.
Findings: moving data into Excel and drawing charts
The findings section only shows what you measured; commentary and cause-and-effect belong in the conclusion. Instead of putting pages of raw data as tables, use a summary table and a well-drawn chart, and put the raw data in the appendices if you like. You can move the data you copied from the Serial Monitor into Excel with the steps below; for more automatic methods, see Transferring data from Arduino to Excel.
- Paste the lines you copied into cell A1 of an empty Excel sheet; all the data will appear in a single column.
- Select column A, choose Data > Text to Columns, then the Delimited option and tick semicolon as the delimiter.
- In the last step press the Advanced button and set the decimal separator to a point; otherwise Excel with Turkish settings may treat values like 23.50 as dates or text.
- To convert seconds to minutes, type the formula =A2/60 in an empty column and copy it down.
- Select the data, pick the straight-line chart under Insert > Scatter (X, Y) and write the axis titles with their units: "Time (min)" and "Temperature (°C)".
- If you've put the results of the three repeats in adjacent columns, use =AVERAGE(B2:D2) for the mean and =STDEV.S(B2:D2) for the standard deviation, and add error bars to the chart.
| Cup | Start (°C) | 30th minute (°C) | Drop (°C) | Drop rate (%) |
|---|---|---|---|---|
| Uninsulated (control) | 70.0 | 48.0 | 22.0 | 31.4 |
| Aluminium foil | 70.0 | 53.0 | 17.0 | 24.3 |
| 1 cm polystyrene | 70.0 | 61.0 | 9.0 | 12.9 |
The table above contains example values showing the mean of the three repeats. The drop rate is calculated with this formula: (start − end) / start × 100. According to the common rule in academic writing, the table caption goes above the table and the figure caption goes below the figure. Give values with at most one or two decimal places; with a sensor accuracy of ±0.5 °C, writing 48.0625 °C gives an impression of precision that doesn't really exist. The reason for choosing a scatter chart instead of a line chart is that the horizontal axis is then scaled by the actual time values. If you want to smooth noisy sensor data, you can use the moving-average method in sensor data filtering; just be sure to state in the report which filter you applied.
Conclusion, discussion and recommendations
In the conclusion you write what the findings mean and whether your hypothesis was confirmed: "The temperature drop in the polystyrene-wrapped cup was about 41% of that in the control group; the hypothesis was confirmed." Then compare your results with the sources you mentioned in the introduction and discuss possible reasons why they turned out similar or different. This is one of the parts the jury cares about most, so be honest about the limitations of the experiment. In our example, the room temperature changing by 1–2 °C during the experiment, the cups being open at the top and the sensor accuracy are possible sources of error. In the recommendations section, describe how you'd improve the project: trying more materials, using cups with lids, extending the measurement to two hours or carrying the result into a real application such as a thermos design.
Citation examples
Every piece of information, figure and code you use in the report should have a source; every citation in the text must appear in the reference list, and every work in the reference list must appear in the text. The most common format in student projects is APA style: in-text citations are written as (Surname, Year), and the reference list is ordered alphabetically by author surname. Whichever style you choose, use the same format throughout the report. Wikipedia, forum posts and video descriptions are not primary sources; if you found something there, track down the original source and cite that. In the examples below you need to fill in the parts in square brackets with your own source's details.
| Source type | In the reference list (APA) | In-text citation |
|---|---|---|
| Book | Monk, S. (2016). Programming Arduino: Getting started with sketches (2nd ed.). McGraw-Hill Education. | (Monk, 2016) |
| Journal article | [Surname, A.] and [Surname, B.] ([Year]). [Article title]. [Journal Name], [Volume]([Issue]), [page range]. | ([Surname] and [Surname], [Year]) |
| Sensor datasheet | [Manufacturer]. ([Year]). DS18B20 programmable resolution 1-Wire digital thermometer [Datasheet]. | ([Manufacturer], [Year]) |
| Web page | [Author or organisation]. ([Year, Month Day]). [Page title]. [Site name]. [URL] | ([Organisation], [Year]) |
| Software library | [Developer]. ([Year]). DallasTemperature ([Version]) [Arduino library]. [URL] | ([Developer], [Year]) |
Common mistakes and how to fix them
| Mistake | Why is it a problem? | Fix |
|---|---|---|
| Describing what the project does but not what it found | Reads like a product presentation and the research isn't visible | Test the system with a measurement and give the result as a number |
| Drawing a conclusion from a single measurement | A chance result can't be told apart from a real effect | Repeat at least 3 times and give the mean and standard deviation |
| Not using a control group | You can't tell what caused the change | Change only one variable and keep the rest constant |
| A chart without axis titles and units | The jury can't interpret the chart | Write a name and unit on each axis and number the figure |
| Adding a screenshot of the code | Can't be read or copied | Add it as text in a monospaced font or put it in the appendices |
| Technical information without sources | Raises suspicion of plagiarism | Tie each piece of information to a source and write the references in a single format |
| Writing the report on the last day | Findings and text don't match and typos remain | Write your method and findings notes right after each experiment |
A good report is half of a good experiment; if you think about the report while building your setup, both your measurements and your writing get stronger. If you haven't chosen your topic yet, have a look at Arduino project ideas for TÜBİTAK, and if you're preparing for the exhibition, science fair project presentation. If you want to build a measurement-based setup, in the BlueGrays app's temperature, light and distance measurement projects you'll find circuit diagrams and code step by step and can easily adapt them to your own experiment.
Frequently asked questions
How many pages should a TÜBİTAK 2204 project report be?
The page limit, font and margins are stated in the application guide published every year and can change from year to year. So check the limit in that year's guide, not from other projects. Staying under the limit isn't a problem; the jury looks at the clarity of the method and data, not the length.
Do you include all of the Arduino code in a project report?
Usually only the critical part, such as the measurement loop, is shown as a short excerpt in the body of the report, while the algorithm is explained in text or with a flowchart. The full code goes into the Appendices as text if the guide allows it. Use a monospaced font instead of a screenshot.
How do you write the references in a TÜBİTAK project report?
The most common format is APA style: in-text citations are written as (Surname, Year) and the reference list is sorted alphabetically by author surname. There are different patterns for books, articles, datasheets and web pages. What matters is using one style consistently from start to finish and having every in-text citation appear in the reference list.
Do you write the school and student names in the project report?
In competitions like 2204, where the preliminary evaluation is done on the report, the report must not contain the names of the student, advisor or school; this information is entered separately in the application system. Also make sure no school logo, name tag or face appears in photos. Check that year's guide for the exact rule.
What is the difference between the findings and conclusion sections?
In the findings section you present only the values you measured, in tables and charts, without commentary. In the conclusion and discussion section you write what those values mean, whether your hypothesis was confirmed and what the error sources are. Mixing the two is one of the things the jury criticises most often.
Can a project report be written with artificial intelligence?
Getting spell-checking or feedback on your draft from AI can make your work easier, but having it write the report from scratch is unethical and makes it harder to answer the jury's questions at the exhibition. These tools can also invent sources that don't exist. Read and verify every source you use yourself.
Projects to build after reading this
See all projects
Measuring Light Intensity with an LDR
Want to see how bright your room is as a number? The LDR, a small part that reacts to light, measures the light around it, and the Arduino writes the value to your computer screen every half second.
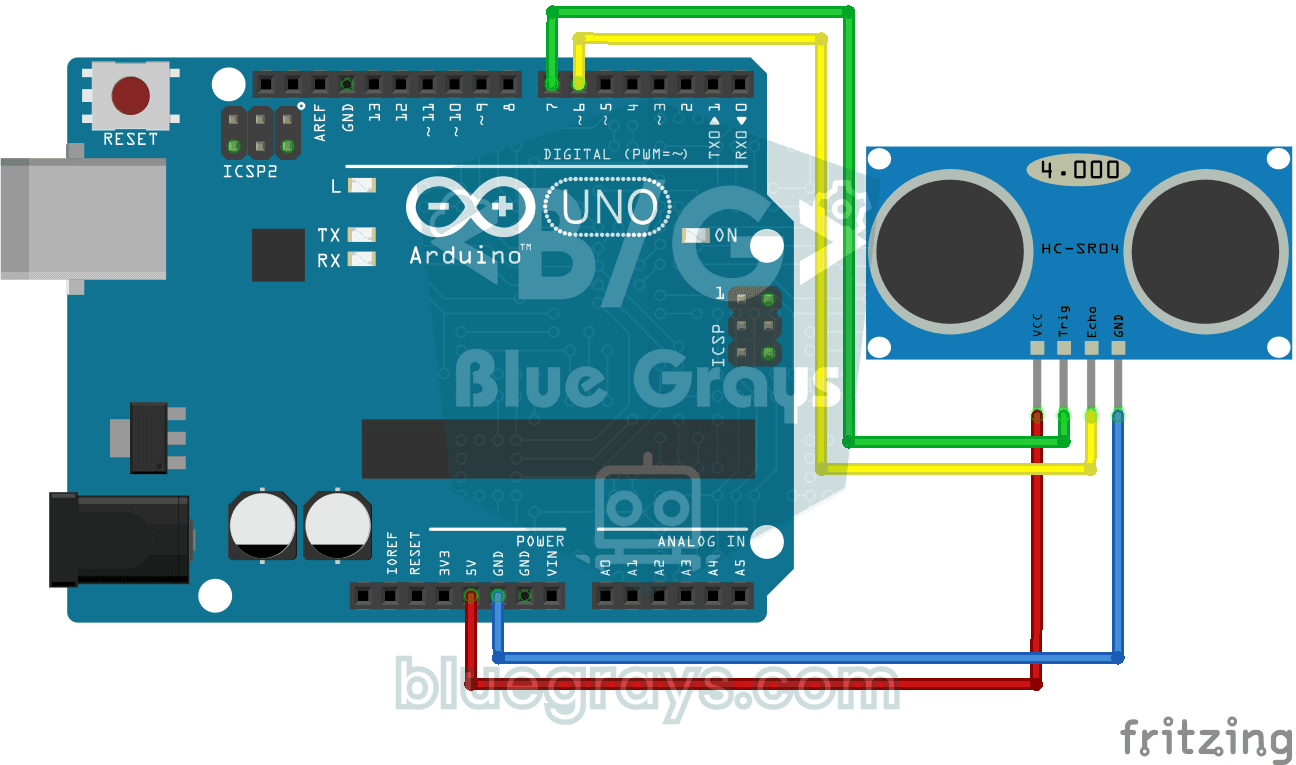
HC-SR04 Distance Measurement (Serial Display)
The HC-SR04 sensor works just like a bat finding its way in the dark: it sends out a sound you cannot hear, listens for the echo and measures how far away the object in front of it is.
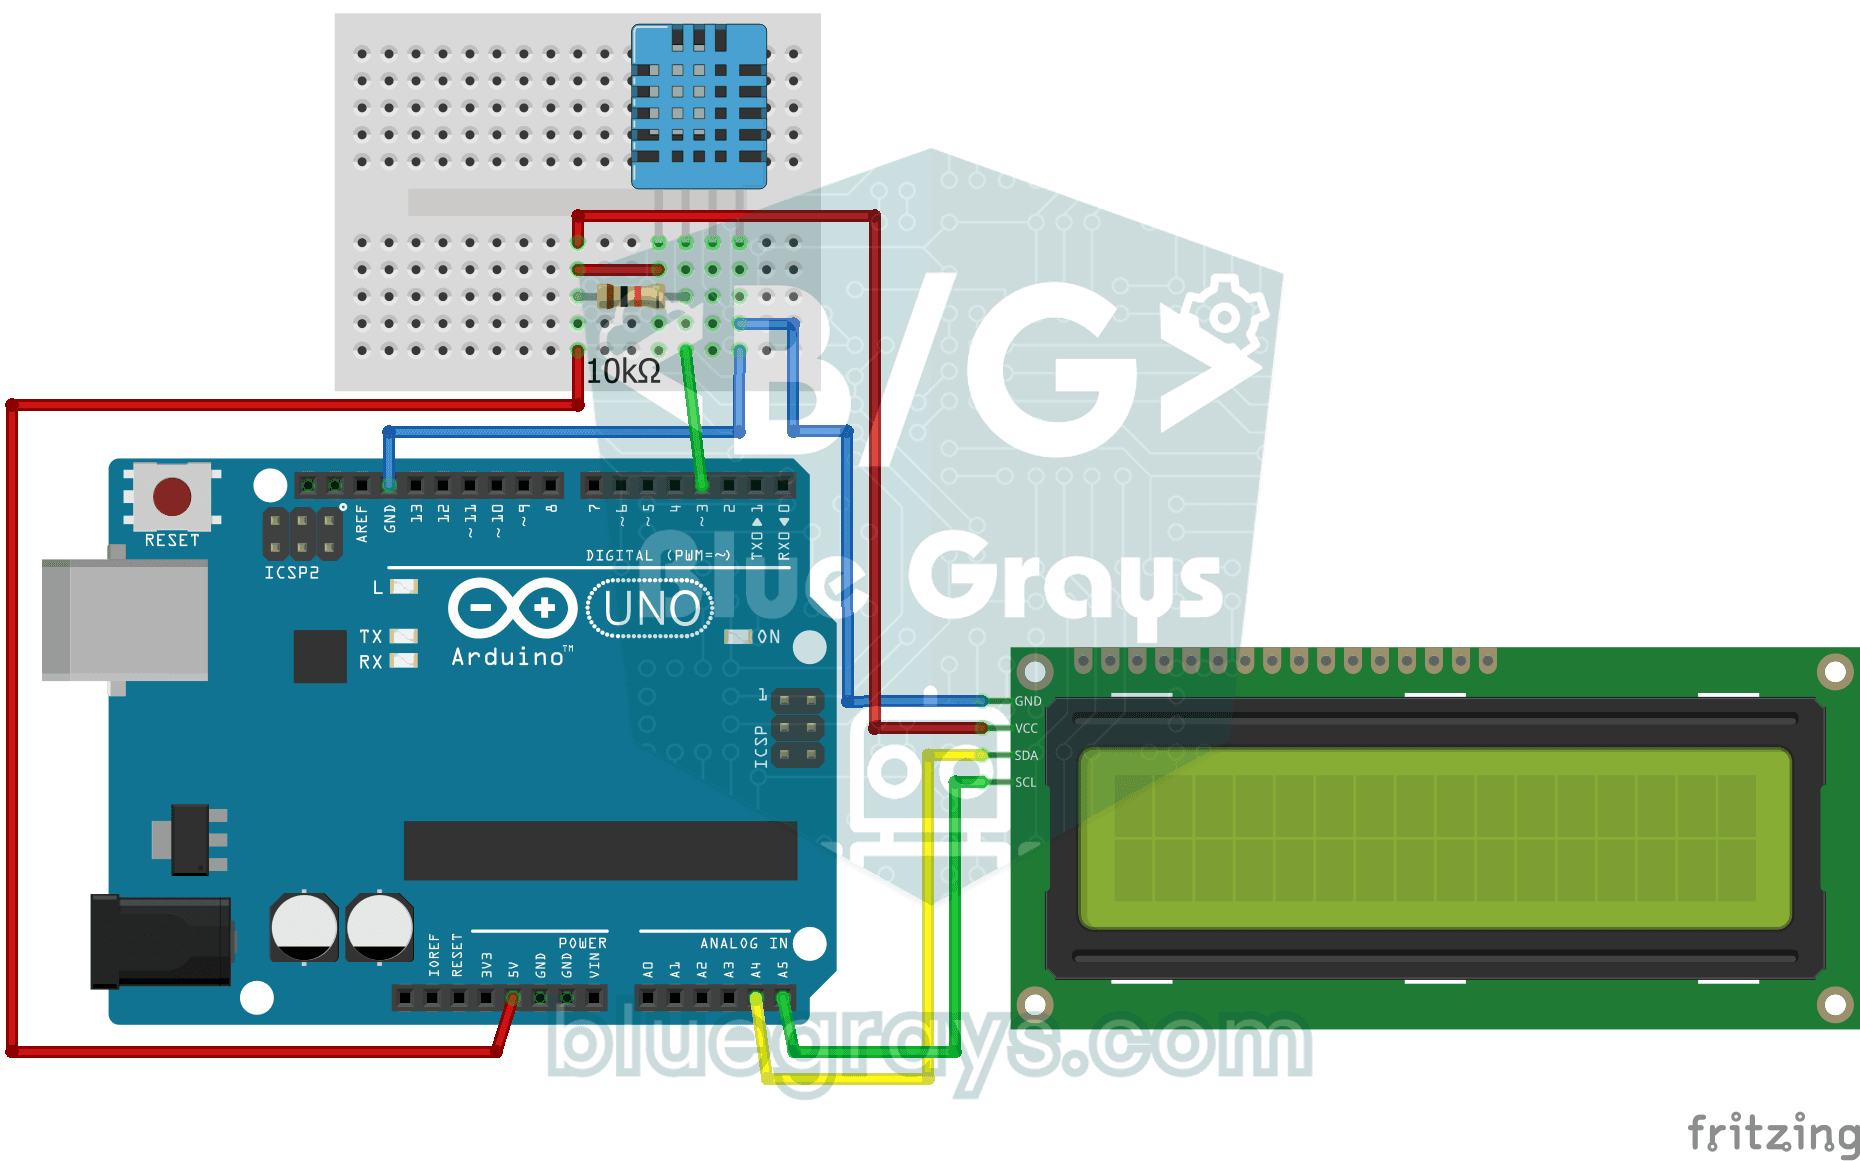
Temperature and Humidity with DHT11
How warm is your room, and is the air humid or dry? The DHT11 sensor measures temperature and humidity, and the Arduino writes the values on a two-line LCD screen, refreshing every couple of seconds.

Reading Light Intensity with the ESP32 LDR Module
Real-time monitoring of the LDR module's raw ADC value and relative light percentage calculated from dark and light reference values in the Serial Monitor. This percentage is not a lux measurement. Teaches the module’s calibration logic. It is ideal to complete this before Project 10, as it is used to determine the threshold value.
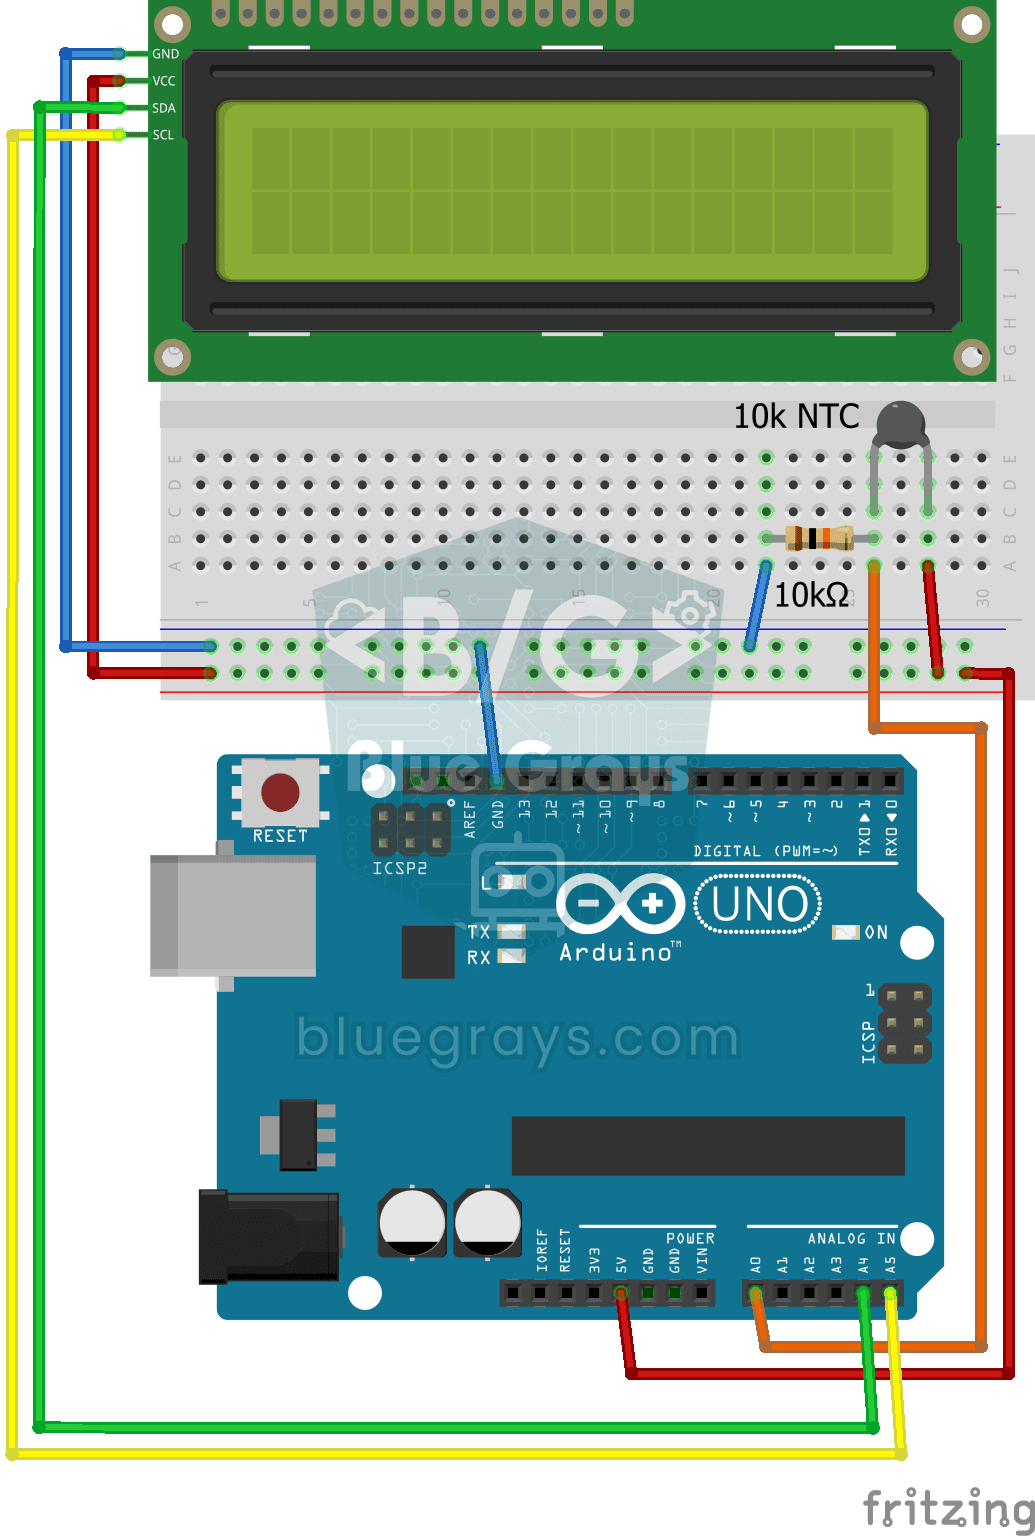
Temperature Measurement with NTC and 2x16 Lcd Display
Measure the temperature around you with a sensor that looks like a tiny bead. This part, called an NTC, lets electricity through more easily as it warms up; the Arduino reads that change, turns it…
Digital Voltmeter with LCD Display
Find out how much voltage a battery or power adapter gives with a meter you built yourself.
ESP32 Temperature Data Logger (DHT22 + DS1307 RTC + microSD + OLED)
Build a timed temperature and humidity logger with the ESP32! A DHT22 sensor reads temperature and humidity once a minute, and each reading is saved to a microSD card in CSV format with a real-time stamp from the DS1307 RTC module. The OLED display shows the latest temperature, humidity, timestamp and total number of records live, in large text.

Smart Irrigation Station
A gardener that waters your plants on its own, so they don't dry out while you're on vacation.