
Arduino Weather Station: DHT22, BMP280, Rain Sensor and LCD
Build an Arduino weather station: DHT22 temperature and humidity, BMP280 pressure, rain sensor, LDR, I2C address table, rotating LCD pages and SD logging.
An Arduino weather station is one of the most enjoyable projects to learn with: a few cheap sensors measure the temperature, humidity, air pressure and rain on your balcony or in your garden and show them on a display. In this guide you'll connect a DHT22 (temperature and humidity), a BMP280 (pressure), a rain sensor and an LDR for telling day from night to an Arduino Uno, and show the readings on a 16x2 I2C LCD in pages that change every few seconds. Add a microSD module and the station keeps a one-line log every hour; after a few days you can chart the data in Excel.
The project goes beyond reading sensors: we'll convert the measured pressure to sea-level pressure for your altitude so you can compare it with weather websites, calculate the dew point from temperature and humidity, and predict whether the weather is about to turn from the pressure change over the last three hours. In order, you'll find the wiring and I2C address tables, step-by-step assembly, the complete code, the maths explained, hourly logging, a Wi-Fi version with the ESP32, placing the sensors outdoors and common mistakes.
What does an Arduino weather station measure?
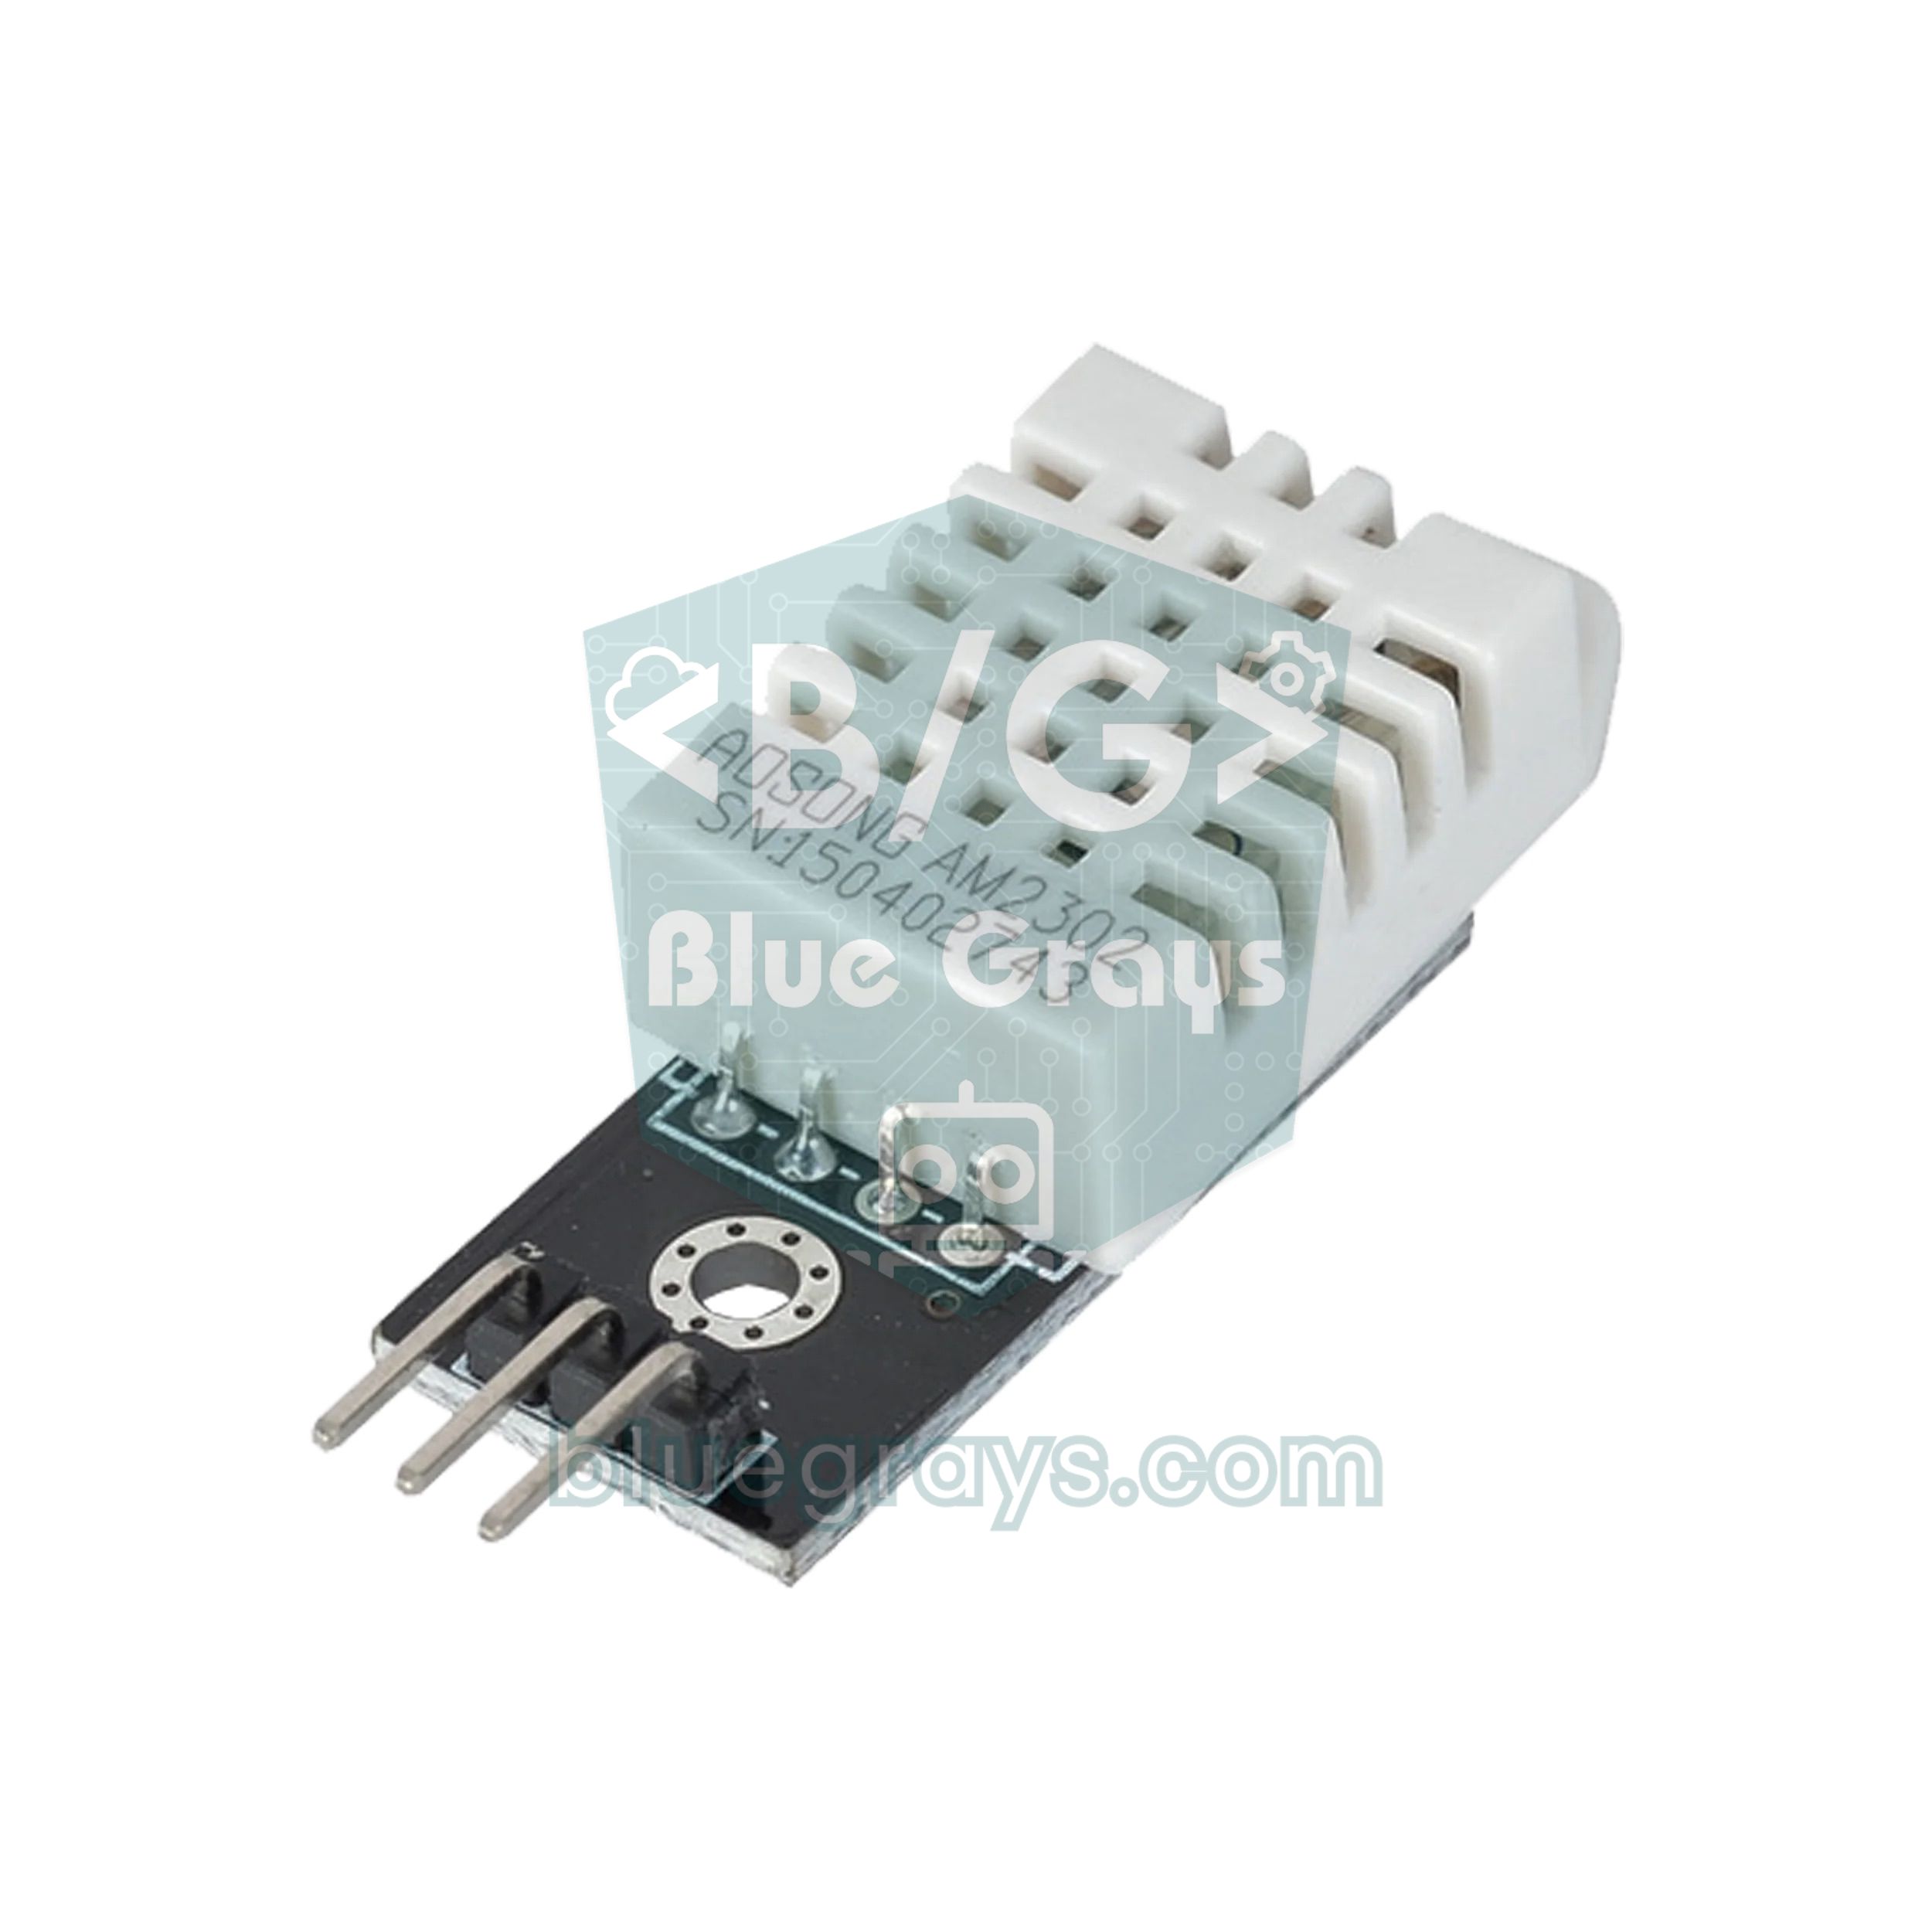
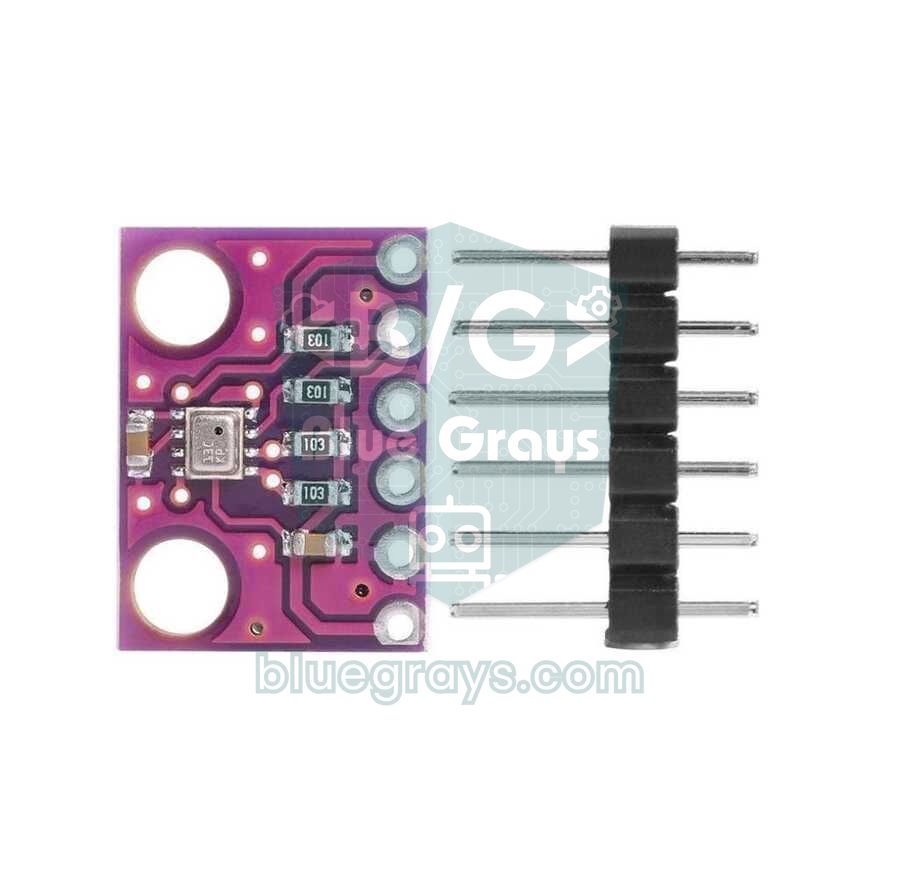
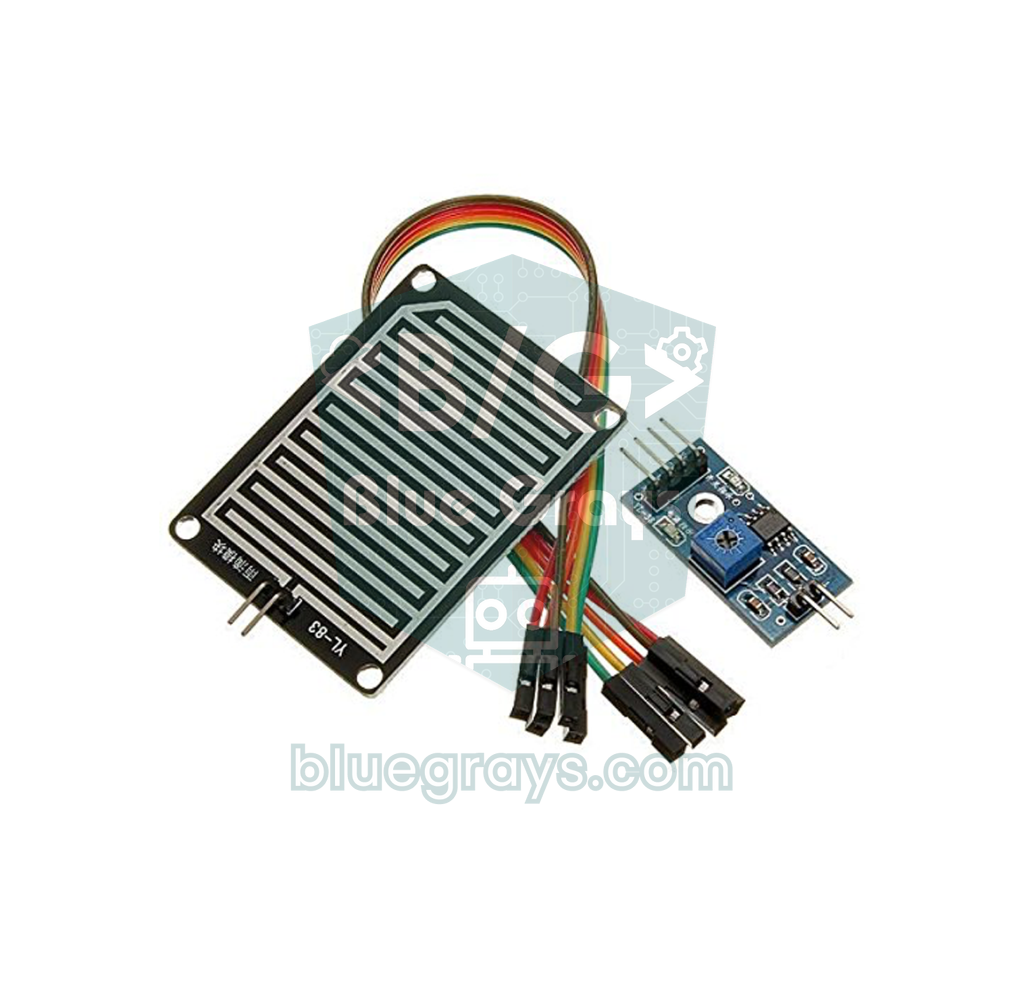
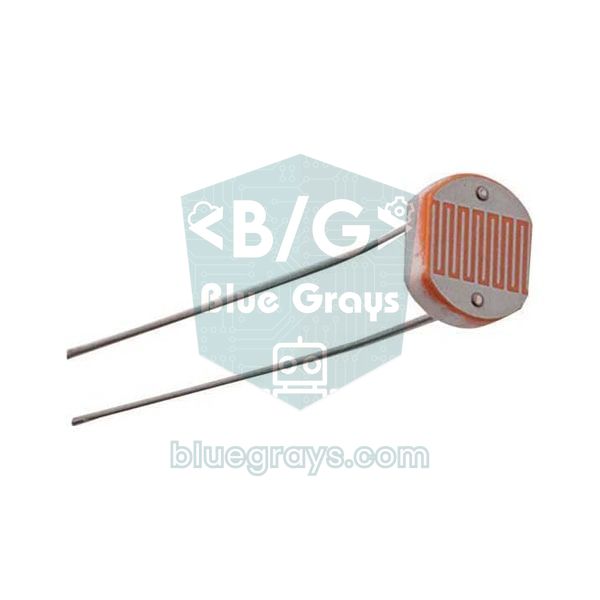
Each sensor was picked because it does one job best. The DHT22 delivers temperature and relative humidity over a single data line and is far more accurate than the DHT11. The BMP280 measures air pressure in hectopascals (hPa) to ±1 hPa; a change in pressure is the most reliable sign of approaching rain. The rain sensor's board gives an analog value that drops as it gets wet. The LDR is a simple photoresistor whose resistance changes with light, which is enough to tell day from night. Everything is shown on the I2C LCD; the display and the BMP280 share the same two wires (SDA and SCL).
| Measurement | Sensor | Range and accuracy | Connection |
|---|---|---|---|
| Temperature and humidity | DHT22 (AM2302) | -40…80 °C ±0.5 °C; 0–100 % ±2–5 % | Single data line (D2) |
| Air pressure | BMP280 | 300–1100 hPa, ±1 hPa | I2C (A4, A5) |
| Rain | FC-37 / YL-83 board and LM393 module | Wetness percentage (calibrated in code) | Analog A0, power from D7 |
| Day / night | LDR (GL5528) and 10 kΩ resistor | Rough light level | Analog A1 |
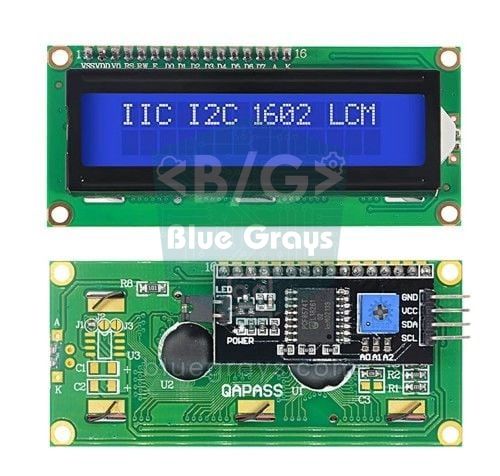
| Display | 16x2 LCD with I2C backpack (PCF8574) | 2 rows × 16 characters | I2C (A4, A5) |
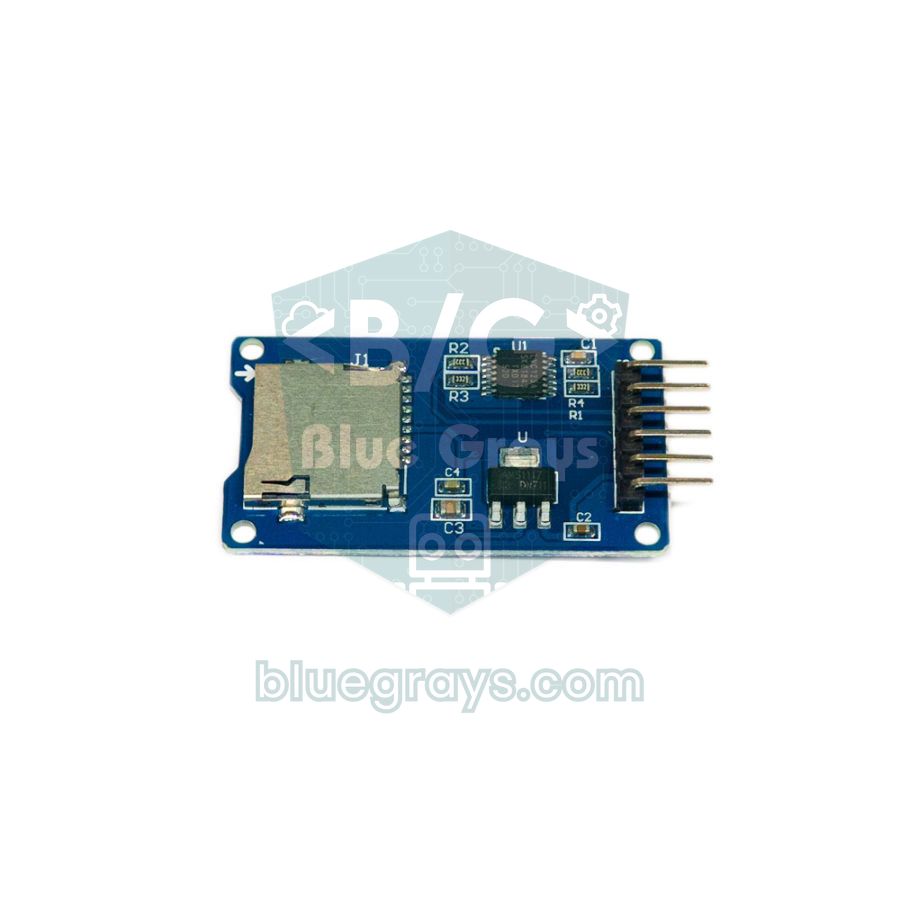
| Logging (optional) | microSD card module | FAT32, CSV file | SPI (D10–D13) |
Parts list
- Arduino Uno (an Arduino Nano works with the same pins)
- DHT22 module (three pins, pull-up resistor on board) or a four-pin DHT22 and a 10 kΩ resistor
- BMP280 module (the 5 V version with a regulator is preferable) or a BME280, which also measures humidity
- Rain sensor board and LM393 comparator module
- LDR and 10 kΩ resistor
- 16x2 LCD with an I2C backpack soldered on
- microSD card module with a regulator and a card of up to 32 GB formatted as FAT32 (optional)
- Breadboard, jumper wires and a 5 V USB adapter that supplies at least 1 A
Wiring diagram: pin table and I2C addresses
The key idea of the circuit is the shared I2C bus: the LCD and the BMP280 are wired in parallel to the same SDA (A4) and SCL (A5) pins, and the Arduino reaches each one at a different address. The SD module uses the SPI bus (D10–D13), so it doesn't clash with I2C. The rain module's VCC goes to D7 rather than straight to 5V: the code powers the board for just a few milliseconds while measuring, which slows corrosion dramatically. We explain how the I2C bus works in What Is I2C?.
| Part and pin | Arduino Uno | ESP32 (Wi-Fi version) |
|---|---|---|
| DHT22 VCC / GND | 5V / GND | 3V3 / GND |
| DHT22 DATA | D2 | GPIO 4 |
| BMP280 VCC | 3.3V (6-pin) or 5V (with regulator) | 3V3 |
| BMP280 SDA / SCL | A4 / A5 | GPIO 21 / GPIO 22 |
| LCD I2C backpack VCC / SDA / SCL | 5V / A4 / A5 | Not used (web page) |
| Rain module VCC | D7 (only while measuring) | GPIO 25 |
| Rain module AO | A0 | GPIO 34 (ADC1) |
| LDR and 10 kΩ divider | LDR to 5V, 10 kΩ to GND, midpoint to A1 | LDR to 3V3, 10 kΩ to GND, midpoint to GPIO 35 |
| SD module CS / MOSI / MISO / SCK | D10 / D11 / D12 / D13 | Not used |
| SD module VCC | 5V | — |
| I2C device | Default address | Note |
|---|---|---|
| LCD I2C backpack (PCF8574T) | 0x27 | 0x20–0x27 with the solder jumpers |
| LCD I2C backpack (PCF8574AT) | 0x3F | 0x38–0x3F with the solder jumpers |
| BMP280 (purple modules) | 0x76 | 0x77 if the SDO pin goes to 3.3 V |
| BMP280 (Adafruit board) | 0x77 | 0x76 if SDO goes to GND |
| BME280 (instead of BMP280) | 0x76 or 0x77 | Chip ID 0x60; the BMP280's is 0x58 |
| DS3231 / DS1307 RTC (optional) | 0x68 | The EEPROM on the DS3231 module is at 0x57 |
Installing the libraries
- Open the Library Manager in the Arduino IDE and install LiquidCrystal I2C (Frank de Brabander).
- Search for Adafruit BMP280 Library; when it asks about dependencies choose Install all, so Adafruit Unified Sensor and Adafruit BusIO are installed too.
- Install DHT sensor library (Adafruit).
- The SD and SPI libraries come with the Arduino IDE, so there's nothing to install. Installation details are in adding libraries in Arduino.
Step-by-step assembly
- Build the I2C bus first: connect the LCD and the BMP280 to A4 and A5, run the I2C scanner and note the two addresses.
- Add the DHT22: connect the data pin to D2. If you're using the bare four-pin sensor, put a 10 kΩ pull-up resistor between data and VCC.
- Connect the rain sensor: connect the board to the module, the module's VCC to D7 and AO to A0. Measure the values with the board dry and wet and write them into the RAIN_DRY and RAIN_WET constants in the code.
- Build the LDR divider: connect one leg of the LDR to 5V and the other to A1, and a 10 kΩ resistor from A1 to GND. The brighter it gets, the higher the reading.
- Add the SD module: power it from 5V and connect CS to D10, MOSI to D11, MISO to D12 and SCK to D13. Without a card, the station keeps working without logging.
- Enter your altitude: look up the height above sea level of your location and put it in the ALTITUDE_M constant; the accuracy of the pressure calculation depends on it.
Weather station code: rotating pages and hourly SD logging
The code below brings all the parts together. The sensors are read every 5 seconds, the display cycles through three pages every 4 seconds and, if an SD card is fitted, one line is logged at power-up and then one every hour. Because it uses millis() instead of delay(), the three tasks don't wait for each other. The display labels are short abbreviations: T temperature, H humidity, Dew pt dew point and P pressure.
1#include <Wire.h>
2#include <LiquidCrystal_I2C.h>
3#include <Adafruit_BMP280.h>
4#include <DHT.h>
5#include <SPI.h>
6#include <SD.h>
7
8// Pinler / pins
9const byte DHT_PIN = 2;            // DHT22 veri / DHT22 data
10const byte RAIN_POWER_PIN = 7;     // yağmur modülü VCC / rain module VCC
11const byte RAIN_PIN = A0;          // yağmur modülü AO / rain module AO
12const byte LDR_PIN = A1;           // LDR bölücü orta noktası / LDR divider midpoint
13const byte SD_CS_PIN = 10;         // SD modülü CS / SD module CS
14
15// Kendi değerlerinle değiştir / replace with your own values
16const float ALTITUDE_M = 850.0;    // rakım, metre / altitude in metres
17const int RAIN_DRY = 1015;         // kuru pano okuması / dry board reading
18const int RAIN_WET = 350;          // ıslak pano okuması / wet board reading
19const byte RAIN_ON = 25;           // % ve üstü: yağıyor / % and above: raining
20const byte RAIN_OFF = 10;          // % ve altı: kurudu / % and below: dry
21const int DAY_LEVEL = 450;         // LDR bu değerin üstünde: gündüz / above: day
22const int NIGHT_LEVEL = 350;       // LDR bu değerin altında: gece / below: night
23
24const unsigned long READ_MS = 5000UL;     // sensör okuma aralığı / sensor read interval
25const unsigned long PAGE_MS = 4000UL;     // sayfa süresi / page duration
26const unsigned long LOG_MS = 3600000UL;   // saatte bir kayıt / log once an hour
27
28LiquidCrystal_I2C lcd(0x27, 16, 2);       // adres 0x27 ya da 0x3F / address 0x27 or 0x3F
29Adafruit_BMP280 bmp;
30DHT dht(DHT_PIN, DHT22);
31
32float temperature = NAN, humidity = NAN, pressure = NAN, dewPoint = NAN;
33float history[4] = {NAN, NAN, NAN, NAN};  // saatlik basınç geçmişi / hourly pressure history
34int rainPercent = 0, light = 0;
35bool raining = false, isDay = true, bmpOk = false, sdOk = false, firstLog = true;
36byte page = 0;
37unsigned long lastRead = 0, lastPage = 0, lastLog = 0;
38
39float calcDewPoint(float t, float rh) {   // Magnus formülü / Magnus formula
40  const float a = 17.62, b = 243.12;
41  float g = log(rh / 100.0) + a * t / (b + t);
42  return b * g / (a - g);
43}
44
45int readRain() {
46  digitalWrite(RAIN_POWER_PIN, HIGH);     // panoyu yalnız ölçerken besle / power the board only while measuring
47  delay(20);
48  long sum = 0;
49  for (byte i = 0; i < 4; i++) sum += analogRead(RAIN_PIN);
50  digitalWrite(RAIN_POWER_PIN, LOW);      // korozyonu yavaşlatır / slows corrosion
51  return constrain(map(sum / 4, RAIN_DRY, RAIN_WET, 0, 100), 0, 100);
52}
53
54void readSensors() {
55  float t = dht.readTemperature();
56  float h = dht.readHumidity();
57  if (!isnan(t) && !isnan(h)) {           // hatalı okumada eski değer kalır / keep the old value on a failed read
58    temperature = t;
59    humidity = h;
60    dewPoint = calcDewPoint(t, h);
61  }
62  if (bmpOk && bmp.takeForcedMeasurement()) {   // tek ölçüm, az ısınma / one-shot, less self-heating
63    pressure = bmp.seaLevelForAltitude(ALTITUDE_M, bmp.readPressure() / 100.0);   // deniz seviyesi, hPa / sea level, hPa
64  }
65  rainPercent = readRain();
66  if (!raining && rainPercent >= RAIN_ON) raining = true;    // histerezis / hysteresis
67  if (raining && rainPercent <= RAIN_OFF) raining = false;
68  light = analogRead(LDR_PIN);
69  if (!isDay && light >= DAY_LEVEL) isDay = true;
70  if (isDay && light <= NIGHT_LEVEL) isDay = false;
71}
72
73float trend3h() {                         // son 3 saatteki basınç değişimi / pressure change over 3 hours
74  if (isnan(history[0]) || isnan(history[3])) return NAN;
75  return history[3] - history[0];
76}
77
78void showPage() {
79  lcd.clear();
80  if (page == 0) {                        // sıcaklık, nem, çiy noktası / temperature, humidity, dew point
81    lcd.print(F("T "));
82    lcd.print(temperature, 1);
83    lcd.print((char)223);                 // derece işareti / degree sign
84    lcd.print(F("C  H "));
85    lcd.print(humidity, 0);
86    lcd.print('%');
87    lcd.setCursor(0, 1);
88    lcd.print(F("Dew pt "));
89    lcd.print(dewPoint, 1);
90    lcd.print((char)223);
91    lcd.print('C');
92  } else if (page == 1) {                 // basınç ve eğilim / pressure and trend
93    lcd.print(F("P "));
94    lcd.print(pressure, 1);
95    lcd.print(F(" hPa"));
96    lcd.setCursor(0, 1);
97    float tr = trend3h();
98    if (isnan(tr)) {
99      lcd.print(F("3h trend: wait"));     // ilk 3 saat / first 3 hours
100    } else {
101      lcd.print(F("3h "));
102      if (tr > 0) lcd.print('+');
103      lcd.print(tr, 1);
104      if (tr <= -1.6) lcd.print(F(" Falling"));
105      else if (tr >= 1.6) lcd.print(F(" Rising"));
106      else lcd.print(F(" Steady"));
107    }
108  } else {                                // yağmur, ışık, SD durumu / rain, light, SD status
109    lcd.print(F("Rain "));
110    lcd.print(rainPercent);
111    lcd.print(raining ? F("% RAIN") : F("% dry"));
112    lcd.setCursor(0, 1);
113    lcd.print(isDay ? F("Day  ") : F("Night"));
114    lcd.print(sdOk ? F(" SD:ok") : F(" SD:off"));
115  }
116}
117
118void logHourly() {
119  for (byte i = 0; i < 3; i++) history[i] = history[i + 1];   // geçmişi kaydır / shift the history
120  history[3] = pressure;
121  if (!sdOk) return;
122  File f = SD.open("WEATHER.CSV", FILE_WRITE);   // sona ekler / appends
123  if (!f) {
124    sdOk = false;
125    return;
126  }
127  f.print(millis() / 60000UL);            // açılıştan beri dakika / minutes since power-up
128  f.print(',');
129  f.print(temperature, 1);
130  f.print(',');
131  f.print(humidity, 0);
132  f.print(',');
133  f.print(pressure, 1);
134  f.print(',');
135  f.print(dewPoint, 1);
136  f.print(',');
137  f.print(rainPercent);
138  f.print(',');
139  f.println(isDay ? F("day") : F("night"));
140  f.close();                              // elektrik kesilirse veri kaybolmasın / safe against power loss
141}
142
143void setup() {
144  pinMode(RAIN_POWER_PIN, OUTPUT);
145  lcd.init();
146  lcd.backlight();
147  lcd.print(F("Weather station"));
148  dht.begin();
149  bmpOk = bmp.begin(0x76);                // mor modül 0x76, Adafruit 0x77 / purple module 0x76, Adafruit 0x77
150  if (bmpOk) {
151    bmp.setSampling(Adafruit_BMP280::MODE_FORCED, Adafruit_BMP280::SAMPLING_X1,
152                    Adafruit_BMP280::SAMPLING_X1, Adafruit_BMP280::FILTER_OFF);   // hava izleme ayarı / weather monitoring
153  }
154  sdOk = SD.begin(SD_CS_PIN);
155  if (sdOk && !SD.exists("WEATHER.CSV")) {
156    File f = SD.open("WEATHER.CSV", FILE_WRITE);
157    if (f) {
158      f.println(F("minutes,temp_c,hum_pct,press_hpa,dew_c,rain_pct,light"));   // başlık satırı / header row
159      f.close();
160    }
161  }
162  lcd.setCursor(0, 1);
163  lcd.print(bmpOk ? F("BMP280 ok") : F("BMP280 ?"));
164  delay(2000);                            // DHT22 ilk ölçüme hazırlansın / let the DHT22 get ready
165}
166
167void loop() {
168  unsigned long now = millis();
169  if (lastRead == 0 || now - lastRead >= READ_MS) {
170    lastRead = now;
171    readSensors();
172  }
173  if (firstLog || now - lastLog >= LOG_MS) {     // açılışta ve her saat / at power-up and every hour
174    firstLog = false;
175    lastLog = now;
176    logHourly();
177  }
178  if (now - lastPage >= PAGE_MS) {
179    lastPage = now;
180    showPage();
181    page = (page + 1) % 3;                // 3 sayfa arasında dön / cycle through 3 pages
182  }
183}| Constant or function | What it does |
|---|---|
| ALTITUDE_M | Altitude; used to convert the measured pressure to sea level |
| RAIN_DRY / RAIN_WET | The analog values you measured with the board dry and wet |
| RAIN_ON / RAIN_OFF | Rain-start and rain-stop thresholds (%); the gap between them is the hysteresis |
| DAY_LEVEL / NIGHT_LEVEL | The LDR's day and night thresholds; the band in between stops flickering at dawn |
| readRain() | Powers the board from D7, averages 4 readings, cuts the power and converts to a percentage |
| calcDewPoint() | Calculates the dew point with the Magnus formula |
| takeForcedMeasurement() | Makes the BMP280 take a single reading; avoids the self-heating of continuous mode |
| history[4] and trend3h() | Store the hourly pressure values and return the change over the last 3 hours |
| logHourly() | Shifts the pressure history and appends a CSV line to the SD card |
The maths: sea-level pressure, dew point and pressure trend
What the BMP280 measures is the local pressure where you are, and it falls with altitude: pressure that is around 1013 hPa at sea level is about 915 hPa at 850 metres, and in a high-altitude city such as Denver it's around 835 hPa. Weather websites, however, report each station's pressure reduced to sea level. The seaLevelForAltitude() function in the code does this conversion: P0 = P / (1 − h / 44330)^5.255. For 915 hPa measured at 850 metres, 1 − 850 / 44330 = 0.9808 and 0.9808^5.255 ≈ 0.903; 915 / 0.903 ≈ 1013 hPa. Getting the altitude wrong by 10 metres shifts the result by about 1.2 hPa, so take it from a map or GPS as accurately as you can.
The dew point is the temperature at which air starts to condense when cooled, and it's a more meaningful comfort measure than relative humidity: up to 13 °C the air feels comfortable, above 16 °C humid and above 20 °C oppressive. The code uses the Magnus formula: γ = ln(RH / 100) + 17.62·T / (243.12 + T) and Td = 243.12·γ / (17.62 − γ). For 24 °C and 50 % humidity you get γ ≈ 0.890 and Td ≈ 12.9 °C. If the night-time temperature is approaching the dew point, expect fog or dew by morning; if the dew point is below 0 °C, frost forms instead of dew, which makes a good trigger for a frost alarm.
The most useful forecasting tool, though, is the pressure trend: the change over 3 hours tells you far more than the pressure itself. The code stores the pressure in an array every hour; once it has four values, that is 3 hours after power-up, it shows the difference between the latest value and the one from 3 hours earlier, writing Falling for drops of more than 1.6 hPa and Rising for rises. The classification used in meteorology is as follows.
| Pressure change over 3 hours | Class | What it usually means |
|---|---|---|
| Less than 0.1 hPa | Steady | The current weather continues |
| 0.1–1.5 hPa | Rising / falling slowly | A small change; a fall may bring cloud |
| 1.6–3.5 hPa | Rising / falling | A fall raises the chance of rain, a rise brings clearing skies |
| 3.6–6 hPa | Rising / falling quickly | A fall means windy, wet weather is on its way |
| More than 6 hPa | Very rapidly | Storm; a very abrupt change in the weather |
Hourly logging to the SD card and charts in Excel
If an SD card is fitted, the station creates WEATHER.CSV in the card's root folder, writes the column headers on the first line and then appends one line every hour. The Arduino SD library only accepts 8+3 character file names, which is why the name is short. Closing the file after every entry means a power cut loses at most the last line. As the Uno has no real clock, the first column is minutes since power-up; if you want a date and time, add an RTC module and take the timestamp from it. For choosing and formatting the card, see the SD card module article.
| minutes | temp_c | hum_pct | press_hpa | dew_c | rain_pct | light |
|---|---|---|---|---|---|---|
| 0 | 21.4 | 58 | 1016.2 | 12.8 | 0 | day |
| 60 | 20.8 | 61 | 1015.1 | 13.0 | 0 | day |
| 120 | 18.9 | 72 | 1013.4 | 13.7 | 34 | night |
In the example above the pressure dropped 2.8 hPa in two hours and rain began by the third entry; that's the trend warning of rain in action. Open the file on your computer in Excel or Google Sheets and plot the pressure and temperature columns as line charts. If your Excel uses a comma as the decimal separator, values such as 1016.2 may show up as text; when importing, set the column's locale to English (United States). The full method is in sending Arduino data to Excel.
Wi-Fi weather station with the ESP32
If you want to see the readings on your phone, you can connect the same sensors to an ESP32. This version swaps the LCD for a web page served by the ESP32: open the IP address shown in the Serial Monitor on a phone on the same Wi-Fi network and the values appear, with the page refreshing itself every 30 seconds. The /json address returns the same data in a form other programs can read. The ESP32's pins run at 3.3 V: power the sensors from 3V3 and use ADC1 pins (GPIO 32–39), which keep working with Wi-Fi on, for the analog inputs. The ESP32's ADC is 12-bit and reads 0–4095, so you'll need to measure the rain thresholds again.
1#include <WiFi.h>
2#include <WebServer.h>
3#include <Wire.h>
4#include <Adafruit_BMP280.h>
5#include <DHT.h>
6
7const char* ssid = "AgAdi"; // Wi-Fi adın / your Wi-Fi name
8const char* password = "Sifre123"; // Wi-Fi şifren / your Wi-Fi password
9
10const int DHT_PIN = 4; // DHT22 veri / DHT22 data
11const int RAIN_POWER_PIN = 25; // yağmur modülü VCC / rain module VCC
12const int RAIN_PIN = 34; // yağmur AO, ADC1 / rain AO, ADC1
13const int LDR_PIN = 35; // LDR bölücü, ADC1 / LDR divider, ADC1
14const float ALTITUDE_M = 850.0; // rakım, metre / altitude in metres
15const int RAIN_DRY = 4095; // 12 bit: kuru pano / 12-bit: dry board
16const int RAIN_WET = 1400; // kendi ıslak ölçümün / your own wet reading
17
18WebServer server(80);
19Adafruit_BMP280 bmp;
20DHT dht(DHT_PIN, DHT22);
21float temperature = NAN, humidity = NAN, pressure = NAN;
22int rainPercent = 0, lightPercent = 0;
23unsigned long lastRead = 0;
24
25String num(float v, int digits) { // okunamayan değer için null / null for a missing value
26 return isnan(v) ? String("null") : String(v, digits);
27}
28
29void readSensors() {
30 float t = dht.readTemperature();
31 float h = dht.readHumidity();
32 if (!isnan(t) && !isnan(h)) {
33 temperature = t;
34 humidity = h;
35 }
36 if (bmp.takeForcedMeasurement()) {
37 pressure = bmp.seaLevelForAltitude(ALTITUDE_M, bmp.readPressure() / 100.0);
38 }
39 digitalWrite(RAIN_POWER_PIN, HIGH); // yalnız ölçerken besle / power only while measuring
40 delay(20);
41 int raw = analogRead(RAIN_PIN);
42 digitalWrite(RAIN_POWER_PIN, LOW);
43 rainPercent = constrain(map(raw, RAIN_DRY, RAIN_WET, 0, 100), 0, 100);
44 lightPercent = map(analogRead(LDR_PIN), 0, 4095, 0, 100);
45}
46
47void handleRoot() {
48 String html = "<!DOCTYPE html><html><head><meta name='viewport' content='width=device-width,initial-scale=1'>"
49 "<meta http-equiv='refresh' content='30'><title>Weather</title></head>"
50 "<body style='font-family:sans-serif;font-size:1.3em;padding:1em'><h2>Weather station</h2>";
51 html += "<p>Temp: " + num(temperature, 1) + " °C</p>";
52 html += "<p>Humidity: " + num(humidity, 0) + " %</p>";
53 html += "<p>Pressure: " + num(pressure, 1) + " hPa</p>";
54 html += "<p>Rain: " + String(rainPercent) + " %</p>";
55 html += "<p>Light: " + String(lightPercent) + " %</p></body></html>";
56 server.send(200, "text/html", html);
57}
58
59void handleJson() { // başka programlar için / for other programs
60 String json = "{\"temp\":" + num(temperature, 1) + ",\"hum\":" + num(humidity, 0) +
61 ",\"press\":" + num(pressure, 1) + ",\"rain\":" + String(rainPercent) +
62 ",\"light\":" + String(lightPercent) + "}";
63 server.send(200, "application/json", json);
64}
65
66void setup() {
67 Serial.begin(115200);
68 pinMode(RAIN_POWER_PIN, OUTPUT);
69 dht.begin();
70 if (!bmp.begin(0x76)) Serial.println(F("BMP280 yok / not found"));
71 bmp.setSampling(Adafruit_BMP280::MODE_FORCED, Adafruit_BMP280::SAMPLING_X1,
72 Adafruit_BMP280::SAMPLING_X1, Adafruit_BMP280::FILTER_OFF);
73 WiFi.begin(ssid, password);
74 while (WiFi.status() != WL_CONNECTED) delay(300);
75 Serial.print(F("IP: "));
76 Serial.println(WiFi.localIP()); // bu adresi telefonda aç / open this address on your phone
77 server.on("/", handleRoot);
78 server.on("/json", handleJson);
79 server.begin();
80}
81
82void loop() {
83 server.handleClient();
84 if (lastRead == 0 || millis() - lastRead >= 5000) { // 5 sn'de bir oku / read every 5 s
85 lastRead = millis();
86 readSensors();
87 }
88}To view the data from anywhere, save it to Google Sheets or compare your readings with an online forecast, see ESP32 with Google Sheets and ESP32 weather API. The code compiles unchanged on versions 2.x and 3.x of the ESP32 core, because it only uses WiFi and WebServer functions that are the same in both.
Placing the sensors correctly
- Keep the temperature sensor in the shade: a DHT22 in the sun can read 5–10 °C above the real air temperature. Put it in a ventilated white box or in a radiation shield made from stacked plastic plates.
- Keep it away from walls: walls and window frames warmed by the sun push the reading up; mount the sensor at least 30 cm from the wall and, if possible, 1.5–2 m above the ground.
- Leave the electronics indoors: the Arduino, LCD and BMP280 can sit in a closed box, because the pressure inside the box is the same. Only the DHT22, the rain board and the LDR need to be outside.
- Mount the rain board at an angle: tilt it 30–45 degrees so the water runs off when the rain stops; a flat board stays wet for hours.
- Point the LDR at the sky: if a street lamp or balcony light shines on it, the station will think it's daytime; place it away from lamps, facing upwards.
- Watch the cable length: the DHT22 is fine with a few metres of cable; if read errors start beyond 10 metres, lower the pull-up resistor to 4.7 kΩ. The I2C bus is only designed for a few tens of centimetres, so keep the BMP280 next to the Arduino.
Expanding the station: project ideas
- Light intensity: swap the LDR for a BH1750, which measures in lux, and work out the hours of sunshine.
- Air quality: add an MH-Z19 CO2 sensor to an indoor station or a PMS5003 dust sensor to an outdoor one.
- Real timestamps: use an RTC module to write the date and time into the log and record the day's high and low at every midnight.
- Frost and greenhouse alerts: build a frost alarm that sounds a buzzer below 2 °C or a smart greenhouse that controls ventilation.
- Solar power: with a small panel, a TP4056 charging module and an 18650 cell the station no longer needs a socket; in the ESP32 version, deep sleep makes the battery last for weeks.
- Wind and rainfall: count wind speed with a reed-switch anemometer and rainfall in millimetres with a tipping-bucket rain gauge.
Common mistakes and how to fix them
| Symptom | Likely cause | Fix |
|---|---|---|
| The LCD only shows solid blocks | Contrast setting or wrong I2C address | Turn the blue trimpot on the back of the backpack and try 0x3F instead of 0x27 |
| The display shows nan | The DHT22 can't be read: wiring, pull-up or reading more often than every 2 seconds | Check the data wire and the 10 kΩ resistor; the code keeps the old value on a failed read |
| Pressure is nan or never changes | BMP280 not found: address 0x77 or a 3.3 V module powered wrongly | Try begin(0x77) and power the module with the right voltage |
| Pressure is 80–100 hPa below the forecast | No altitude entered, so local pressure is shown | Update ALTITUDE_M with your real altitude |
| The temperature is far too high in the daytime | The sensor is in the sun or heating up inside the box | Use a shaded, ventilated shield |
| High rain percentage even in dry weather | The board is dirty, covered in dew or wrongly calibrated | Clean the board, measure RAIN_DRY again and raise the RAIN_ON threshold |
| The display says SD:off | No card, the card is exFAT or the module is powered from 3.3 V | Format a card of up to 32 GB as FAT32 and connect the module to 5V |
| It flips between Day and Night at dawn | The thresholds are too close together | Leave at least 100 counts between DAY_LEVEL and NIGHT_LEVEL |
This station brings together almost everything you've learnt on Arduino: digital and analog reads, the I2C and SPI buses, multitasking with millis, calculations and data logging. Get each sensor working on its own first, then combine the parts and only then put it all in the box. In the BlueGrays app you'll find temperature and humidity measurement with a DHT11, light readings with an LDR, ESP32 and DHT22 measurement on an LCD, a temperature logger that writes to SD and a weather station with a dot-matrix display, each with step-by-step circuit diagrams and ready-to-use code.
Frequently asked questions
How do you make a weather station with Arduino?
Connect a DHT22 for temperature and humidity, a BMP280 for pressure, a rain sensor and an LDR for light to an Arduino Uno, show the values on an I2C LCD and, if you like, log them to an SD card. Test each sensor on its own first, then combine them in one sketch. Keeping the sensors in the shade and in a ventilated box is the most important condition for accurate readings.
Which is better for a weather station, DHT22 or BME280?
The DHT22 is slightly more accurate for temperature at ±0.5 °C but can only be read every 2 seconds; the BME280 combines temperature, humidity and pressure in one I2C chip. If you want fewer wires and pins, a BME280 on its own is enough. This project uses both because the DHT22 sits outside while the BMP280 can stay inside the box.
Why is my BMP280 pressure lower than the weather forecast?
The sensor measures the local pressure at your altitude, while weather websites report pressure reduced to sea level. Pressure drops by about 12 hPa for every 100 metres of altitude. Enter your altitude in the ALTITUDE_M constant and seaLevelForAltitude() makes the value comparable.
Can an Arduino weather station predict rain?
It can't give an exact forecast, but the pressure trend is a good clue: a drop of more than 1.6 hPa in 3 hours usually means cloud and rain are coming, while a rise points to clearing skies. The rain sensor also catches the moment rain begins. Used together, they make a simple but useful warning system.
Why does the rain sensor corrode and how do I stop it?
When the tracks on the board are powered all the time, electrolysis happens while they're wet and the metal wears away quickly. Connecting the module's VCC to a digital pin and powering the board only while measuring makes it last many times longer. Mounting it at an angle so it dries quickly after rain also slows corrosion.
How long will an Arduino weather station run on batteries?
An Arduino Uno with the LCD backlight and sensors draws about 70–90 mA, so a 2000 mAh power bank keeps it running for about a day. Turning the backlight off extends that, but for long battery life an ESP32 with deep sleep is far better suited. You can work out your own circuit's run time with the battery life calculator.
Projects to build after reading this
See all projects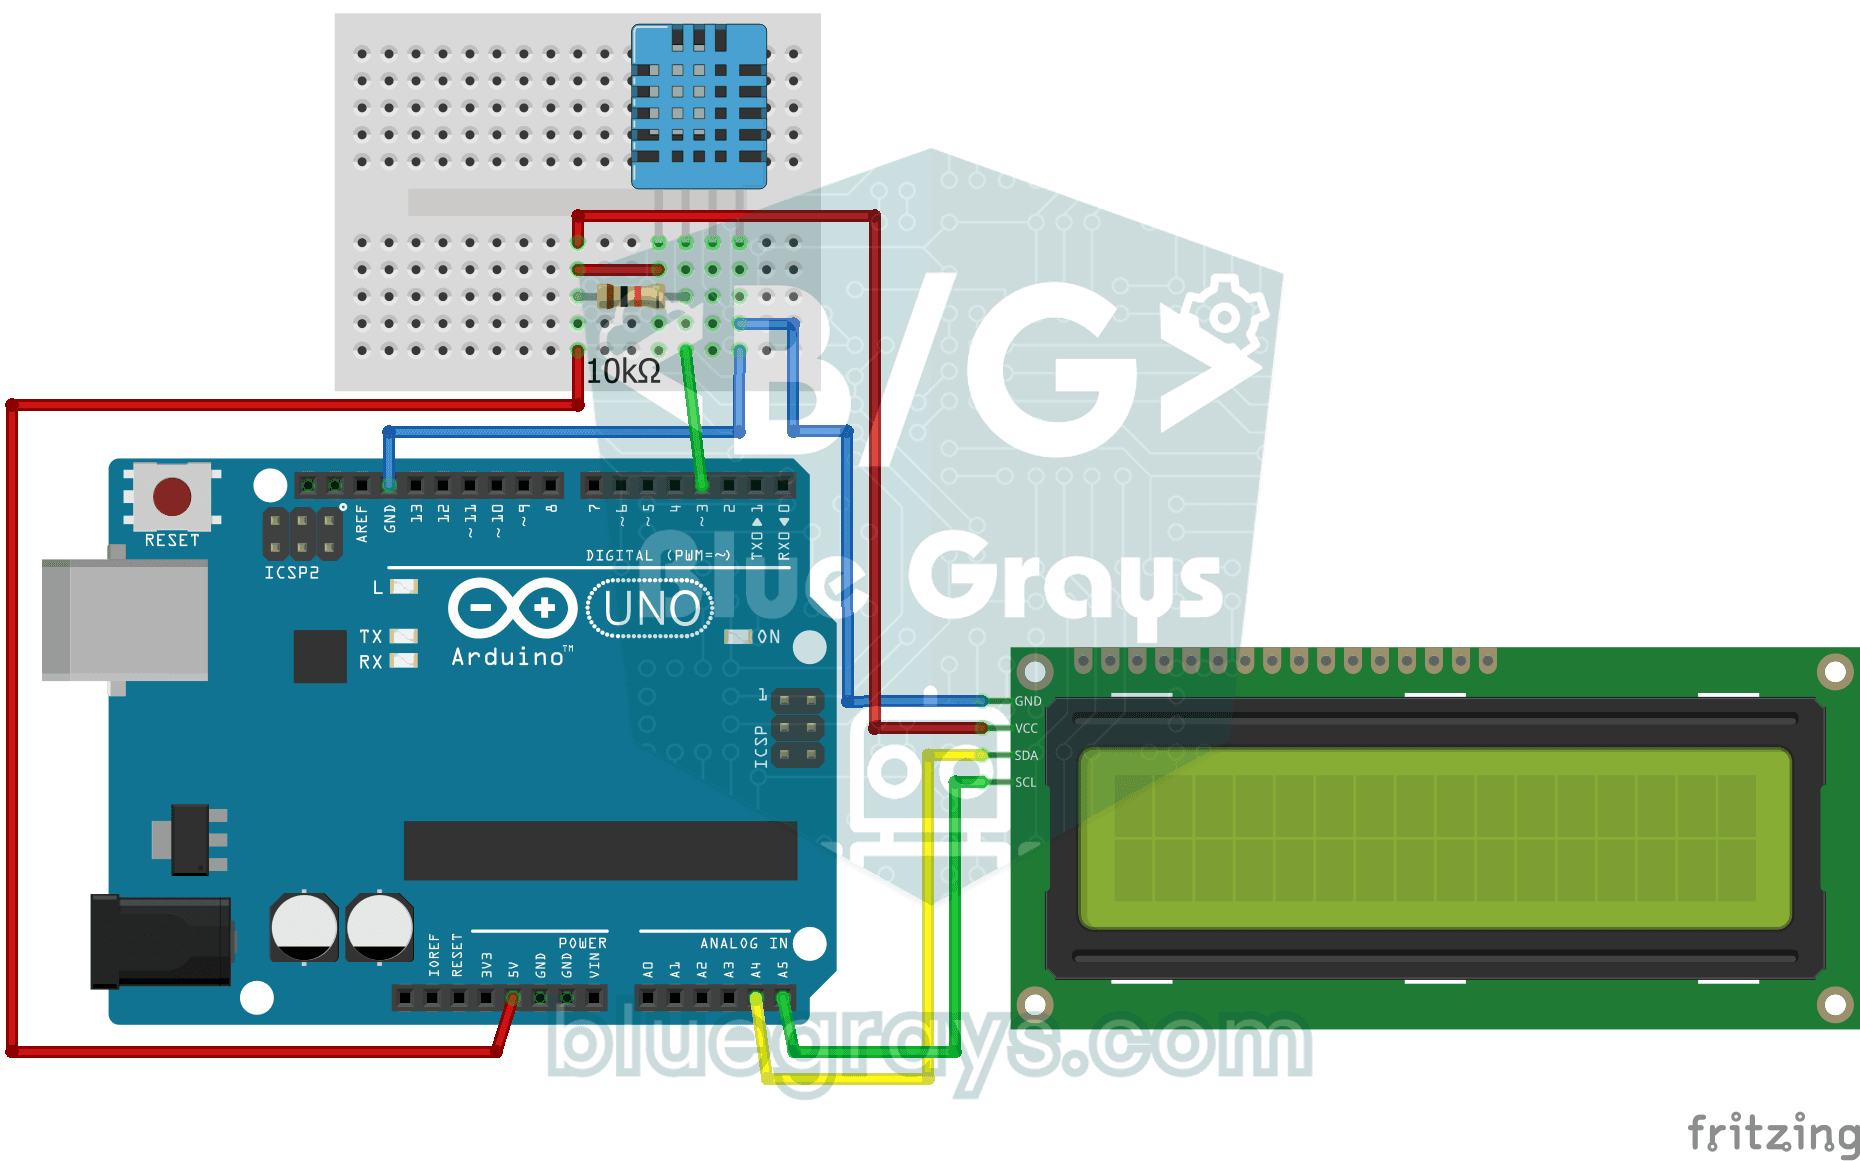
Temperature and Humidity with DHT11
How warm is your room, and is the air humid or dry? The DHT11 sensor measures temperature and humidity, and the Arduino writes the values on a two-line LCD screen, refreshing every couple of seconds.

Measuring Light Intensity with an LDR
Want to see how bright your room is as a number? The LDR, a small part that reacts to light, measures the light around it, and the Arduino writes the value to your computer screen every half second.

Dot Matrix Clock, Calendar and Weather Station (MAX7219, DS1307)
A scrolling-text board for your desk or wall that shows the time, the date and the room's weather in turn.

ESP32 DHT22 Temperature and Humidity (with LCD Display)
This project measures ambient temperature and humidity using a DHT22 sensor and displays the data in real time on a 16x2 I2C LCD. Data is read from the sensor using the one-wire protocol via the Adafruit DHT library. This project serves as the foundation for IoT weather stations, smart home automation, or environmental monitoring systems in greenhouses. Communication with the DHT22 is established via the ESP32's GPIO 4 pin.
ESP32 Temperature Data Logger (DHT22 + DS1307 RTC + microSD + OLED)
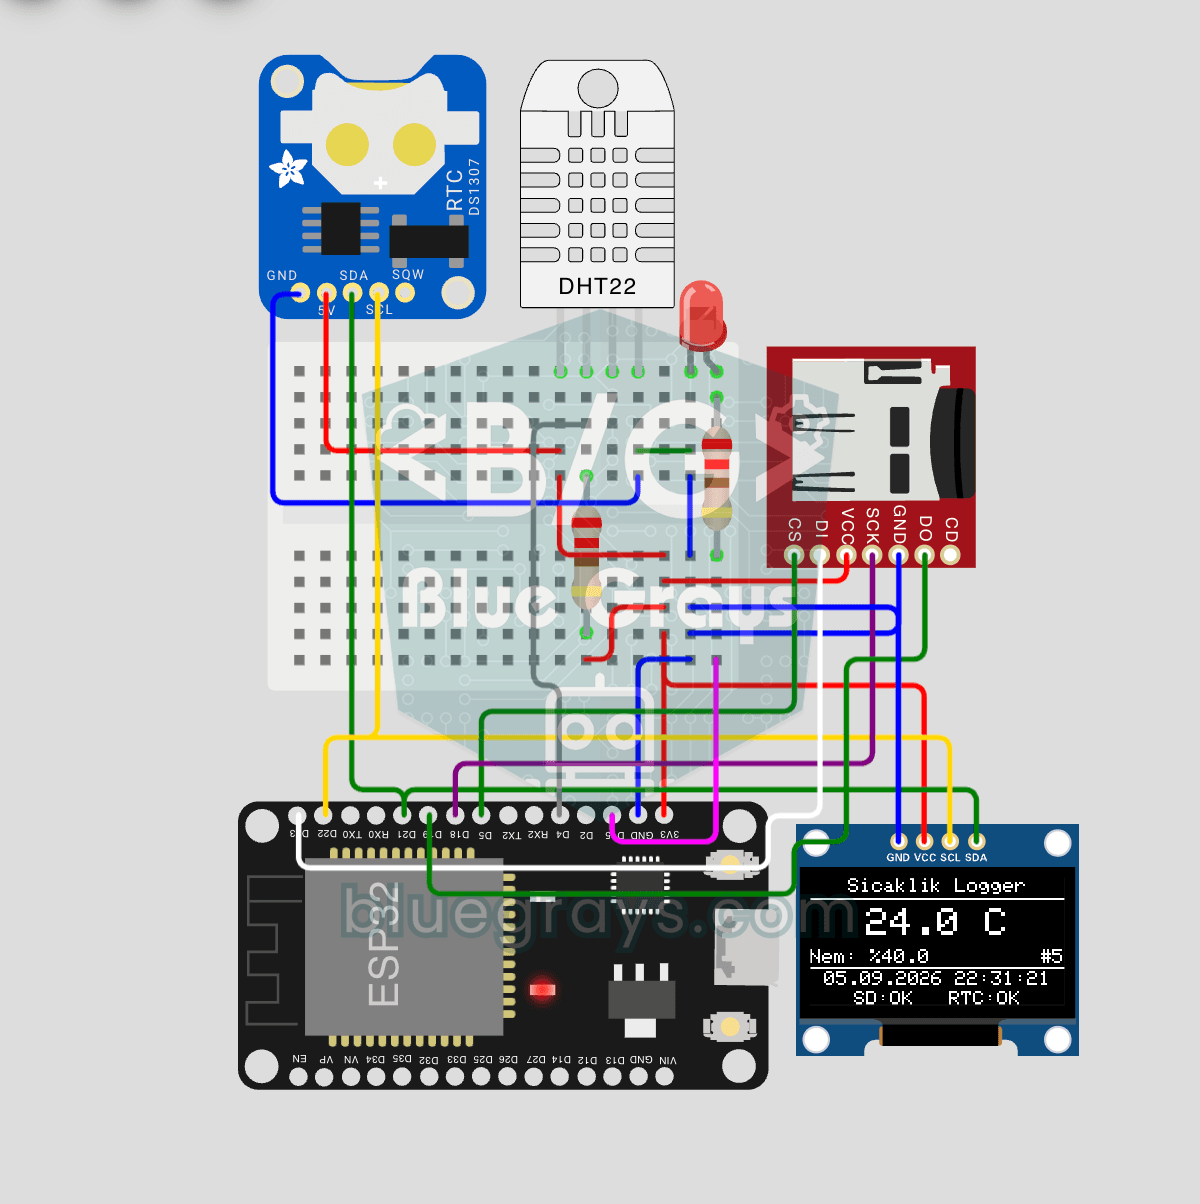
Build a timed temperature and humidity logger with the ESP32! A DHT22 sensor reads temperature and humidity once a minute, and each reading is saved to a microSD card in CSV format with a real-time stamp from the DS1307 RTC module. The OLED display shows the latest temperature, humidity, timestamp and total number of records live, in large text.

ESP32 HTTPClient + Weather API (with LCD Screen)
In this project the ESP32 makes a REST API call over the internet to a weather API (wttr.in) using HTTPClient.h. The JSON response is parsed with ArduinoJson v7, and the city, temperature, humidity, weather and wind are shown on an I2C LCD. wttr.in needs no API key; just type the name of any city.
Temperature Measurement with NTC and 2x16 Lcd Display
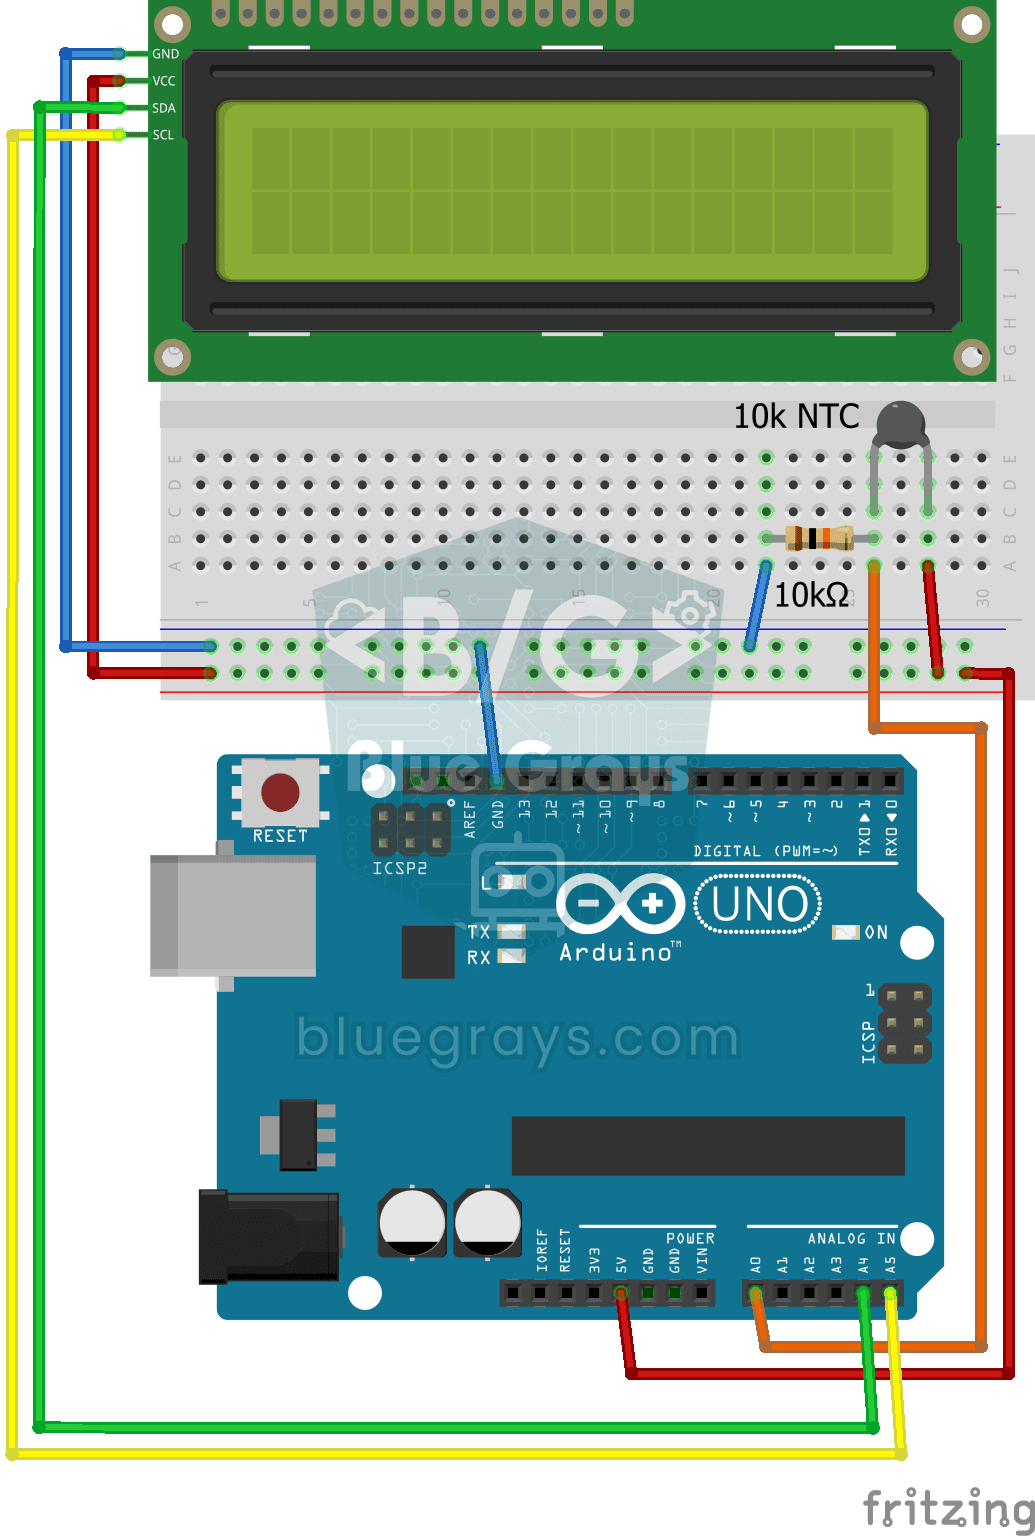
Measure the temperature around you with a sensor that looks like a tiny bead. This part, called an NTC, lets electricity through more easily as it warms up; the Arduino reads that change, turns it…
Using LCD Screen with I2C
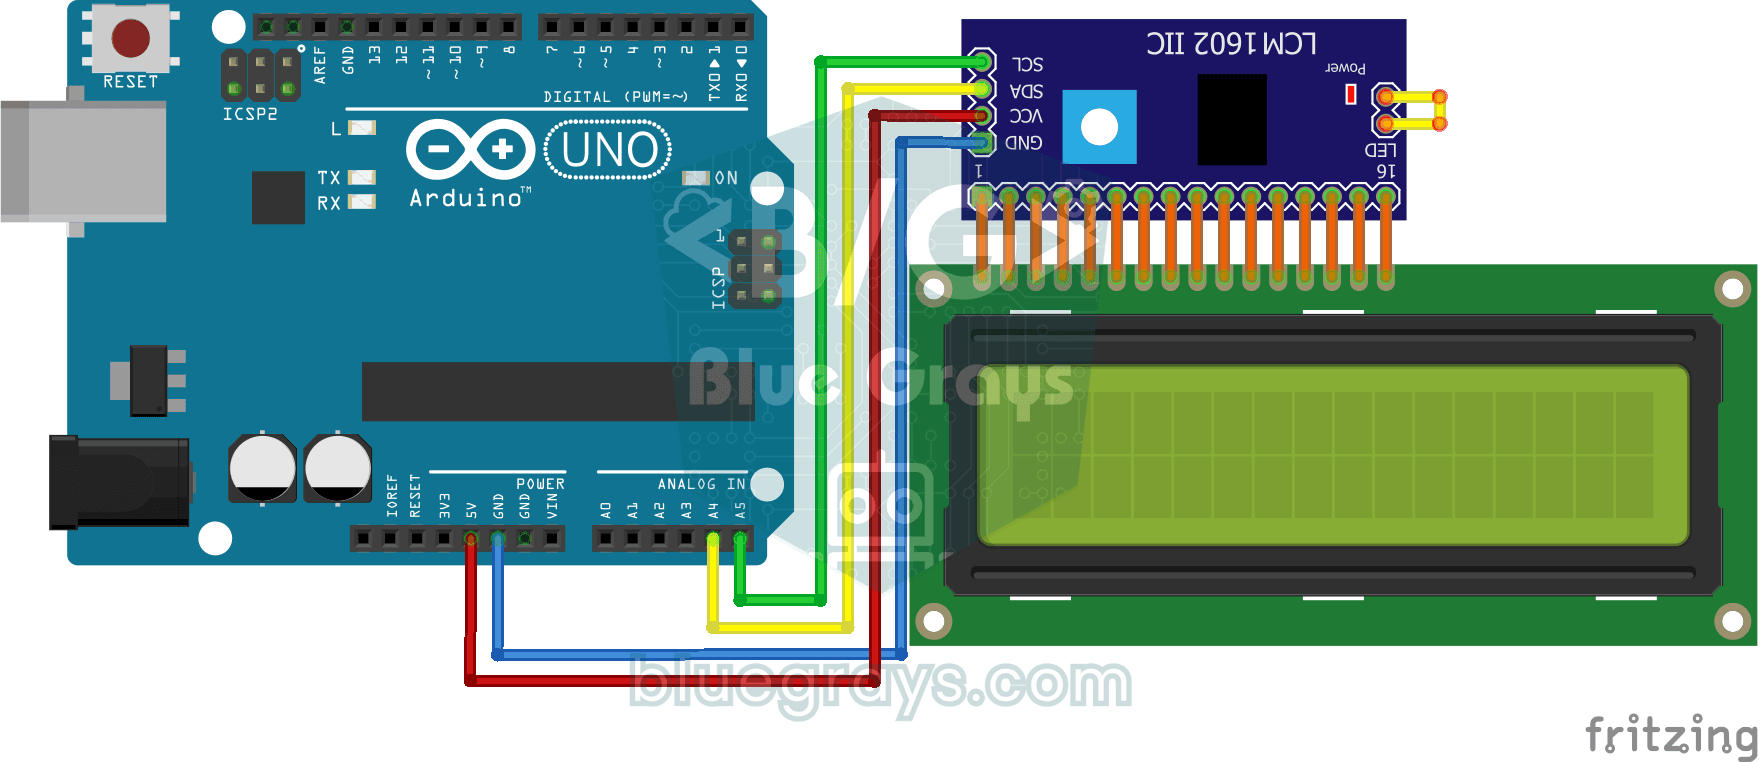
Give your Arduino its own screen and make it write its first message. The two-line LCD screen hooks up with just a few wires; a greeting appears on the top line, then a second message on the bottom…