
PMS5003 Dust Sensor Arduino: Measure PM1.0, PM2.5 and PM10
Connect the PMS5003 dust sensor to Arduino, ESP32 and Pico: UART pins, the 32-byte data frame, sleep mode and an LED PM2.5 air quality indicator.

A dust sensor is the most effective way to turn the invisible particles in the air into numbers in Arduino projects, and the most widely used model is Plantower's PMS5003 laser dust sensor. This small box draws air in with a built-in fan, lights it with a laser beam and analyses the scattered light to report PM1.0, PM2.5 and PM10 concentrations in micrograms per cubic metre (µg/m³). It sends the results by itself every few seconds over a 9600-baud UART line, so an Arduino Uno, ESP32 or Raspberry Pi Pico can read it with just a few wires.
In winter, smoke from stoves and heating, heavy traffic and fog push fine dust levels up quickly in cities, and you often can't tell by eye. In this post you'll learn how the PMS5003 works, how to decode its 32-byte data frame, how to put the sensor to sleep to extend its life, and how to build an air quality indicator that lights green, yellow or red depending on the readings. The code is ready for the Uno with SoftwareSerial, the ESP32 with hardware UART and the Pico with MicroPython.
What is the PMS5003 dust sensor and how does it work?
The PMS5003 works on the principle of laser scattering. A small fan pulls air from the inlet on the housing into the measurement chamber. When the laser beam passing through the chamber hits particles in the air, light scatters in every direction and a photodiode picks up these brief light pulses. The strength of a pulse relates to the particle size, and the number of pulses to the amount of particles. The microcontroller inside the sensor sorts the pulses into size classes between 0.3 µm and 10 µm, calculates the particle count in 0.1 litre of air and converts it to mass concentration using factory calibration. You simply read the finished results from the serial port.
PM stands for "particulate matter"; the number next to it is the largest diameter of the particle in micrometres. PM10 covers all particles smaller than 10 µm (pollen, construction dust, road dust) and mostly gets trapped in the nose and throat. PM2.5 covers particles smaller than 2.5 µm, about 30 times thinner than a human hair; they reach deep into the lungs and are the most closely monitored value for health. PM1.0 is the finest fraction, especially soot and smoke from combustion. Because PM1.0 is counted inside PM2.5 and PM2.5 inside PM10, you always have PM1.0 ≤ PM2.5 ≤ PM10.
| Feature | Value |
|---|---|
| Measuring principle | Laser scattering |
| Measured sizes | 0.3–10 µm (PM1.0, PM2.5, PM10 and particle counts in 6 size classes) |
| Effective range | 0–500 µg/m³ (up to 1000 µg/m³ and above maximum) |
| Accuracy | ±10 µg/m³ between 0–100 µg/m³, ±10% between 100–500 µg/m³ |
| Resolution | 1 µg/m³ |
| Supply | 5 V (4.5–5.5 V), required for the fan |
| Current | ≤ 100 mA running, ≤ 200 µA asleep |
| Communication | UART, 9600 baud, 8N1, 3.3 V logic level |
| Response time | Under 10 seconds (30 s for stable data after waking) |
| Operating environment | -10 to +60 °C, 0–99% relative humidity (non-condensing) |
| Size | 50 × 38 × 21 mm |
| Mean lifetime (MTTF) | At least 3 years |
What do PM2.5 and PM10 values mean?
Official scales are used to interpret the number the sensor gives. The World Health Organization (WHO) 2021 guideline recommends upper limits of 15 µg/m³ as a 24-hour average and 5 µg/m³ as an annual average for PM2.5, and 45 µg/m³ (24 hours) and 15 µg/m³ (annual) for PM10. The US Environmental Protection Agency (EPA) air quality index (AQI) divides PM2.5 into six colour-coded levels. Because these scales are defined for 24-hour averages, using an average over a few minutes instead of a single instant reading gives much more accurate results on your home indicator too.
| PM2.5 (µg/m³, 24 h) | EPA level | Meaning |
|---|---|---|
| 0–9.0 | Good (green) | The air is clean, no risk |
| 9.1–35.4 | Moderate (yellow) | Small risk for very sensitive people |
| 35.5–55.4 | Unhealthy for sensitive groups (orange) | People with asthma or heart disease, children and the elderly should be careful |
| 55.5–125.4 | Unhealthy (red) | Everyone starts to be affected |
| 125.5–225.4 | Very unhealthy (purple) | Limit outdoor activities |
| 225.5 and above | Hazardous (maroon) | Emergency level |
PMS5003 pinout: Arduino Uno, ESP32 and Pico
On the back of the PMS5003 there's a small 8-pin connector with 1.25 mm pitch, which doesn't fit a breadboard. If you use the cable that comes with the sensor and the small adapter board usually included in the package, the pins turn into a standard 2.54 mm header. Pins 7 and 8 are unused. The SET and RESET pins are pulled up inside the sensor, so if you won't use them you can leave them unconnected.
| PMS5003 pin | Function | Arduino Uno | ESP32 | Raspberry Pi Pico |
|---|---|---|---|---|
| 1 VCC | 5 V supply | 5V | 5V (VIN) | VBUS (pin 40) |
| 2 GND | Ground | GND | GND | GND |
| 3 SET | HIGH or open: run, LOW: sleep | D4 (optional) | GPIO 4 | GP2 (optional) |
| 4 RX | Command input to the sensor (3.3 V) | D3 (with voltage divider) | GPIO 17 (TX2) | GP0 (UART0 TX) |
| 5 TX | Data output from the sensor (3.3 V) | D2 | GPIO 16 (RX2) | GP1 (UART0 RX) |
| 6 RESET | LOW: reset | Open | Open | Open |
| 7, 8 | Not connected | - | - | - |
The data frame: what the 32 bytes mean
In the default active mode, the sensor continuously sends results by itself as a 32-byte frame. The frame always starts with the bytes 0x42 and 0x4D (ASCII "BM"), followed by the frame length (28), 13 16-bit data values and a 2-byte checksum. Each 16-bit value is sent high byte first, then low byte (big-endian). The checksum equals the sum of the first 30 bytes, and checking it is the only reliable way to filter out frames corrupted by wiring noise. When air quality changes slowly the sensor sends a frame about every 2.3 seconds, and when it changes quickly every 200–800 ms. If you're curious about the basics of the protocol, take a look at the UART serial communication post.
| Byte | Content | Unit |
|---|---|---|
| 0–1 | Start: 0x42 0x4D | - |
| 2–3 | Frame length (28) | bytes |
| 4–5 | PM1.0 (CF=1, standard particle) | µg/m³ |
| 6–7 | PM2.5 (CF=1) | µg/m³ |
| 8–9 | PM10 (CF=1) | µg/m³ |
| 10–11 | PM1.0 (atmospheric environment) | µg/m³ |
| 12–13 | PM2.5 (atmospheric environment) | µg/m³ |
| 14–15 | PM10 (atmospheric environment) | µg/m³ |
| 16–27 | Particle counts larger than 0.3 / 0.5 / 1.0 / 2.5 / 5.0 / 10 µm (6 values) | count / 0.1 L |
| 28–29 | Reserved | - |
| 30–31 | Checksum (sum of bytes 0–29) | - |
Reading the PMS5003 with an Arduino Uno step by step
- Plug the sensor's cable into the adapter board; connect VCC to the Uno's 5V pin and GND to GND.
- Connect the sensor's TX pin to D2; this pin will be SoftwareSerial's RX.
- If you plan to send commands, connect the sensor's RX pin to D3 through a 10 kΩ / 20 kΩ voltage divider; otherwise leave it unconnected.
- Upload the code below and open the Serial Monitor at 115200 baud.
- Ignore the readings in the first 30 seconds; measurements become stable once the fan speed settles.
- Shake a dusty cloth a few centimetres from the sensor, or blow out a candle, and watch the values rise.
1#include <SoftwareSerial.h>
2
3SoftwareSerial pmsSerial(2, 3);   // D2 = RX (sensör TX'i), D3 = TX (sensör RX'i) / D2 = RX (sensor TX), D3 = TX (sensor RX)
4
5struct PmsData {
6  uint16_t pm1Cf, pm25Cf, pm10Cf;   // CF=1 değerleri / CF=1 values
7  uint16_t pm1, pm25, pm10;         // atmosferik değerler / atmospheric values
8  uint16_t n03, n05, n10;           // 0,1 L'deki parçacık sayısı / particles per 0.1 L
9};
10
11PmsData pms;
12uint8_t buf[32];
13uint8_t idx = 0;
14
15uint16_t word16(uint8_t i) {
16  return ((uint16_t)buf[i] << 8) | buf[i + 1];     // yüksek bayt önce / high byte first
17}
18
19bool readPms(Stream &s, PmsData &d) {
20  while (s.available()) {
21    uint8_t c = s.read();
22    if (idx == 0 && c != 0x42) continue;          // başlangıç baytını bekle / wait for start byte
23    if (idx == 1 && c != 0x4D) {                  // ikinci başlangıç baytı / second start byte
24      idx = (c == 0x42) ? 1 : 0;
25      continue;
26    }
27    buf[idx++] = c;
28    if (idx < 32) continue;
29    idx = 0;                                      // çerçeve tamam / frame complete
30    if (word16(2) != 28) return false;            // uzunluk kontrolü / length check
31    uint16_t sum = 0;
32    for (uint8_t i = 0; i < 30; i++) sum += buf[i];
33    if (sum != word16(30)) return false;          // sağlama toplamı / checksum
34    d.pm1Cf = word16(4);  d.pm25Cf = word16(6);  d.pm10Cf = word16(8);
35    d.pm1   = word16(10); d.pm25   = word16(12); d.pm10   = word16(14);
36    d.n03   = word16(16); d.n05    = word16(18); d.n10    = word16(20);
37    return true;
38  }
39  return false;
40}
41
42void setup() {
43  Serial.begin(115200);
44  pmsSerial.begin(9600);                          // PMS5003 sabit hızı / fixed PMS5003 baud rate
45  Serial.println(F("PMS5003 hazir, 30 sn isinma / warming up 30 s"));
46}
47
48void loop() {
49  if (readPms(pmsSerial, pms)) {
50    Serial.print(F("PM1.0: "));   Serial.print(pms.pm1);
51    Serial.print(F("  PM2.5: ")); Serial.print(pms.pm25);
52    Serial.print(F("  PM10: "));  Serial.print(pms.pm10);
53    Serial.print(F(" ug/m3  |  >0.3um: ")); Serial.print(pms.n03);
54    Serial.println(F(" /0.1L"));
55  }
56}
The heart of the code is the readPms() function. It reads incoming bytes one by one, first looks for the 0x42 and 0x4D start pair, then writes into the buffer until 32 bytes are filled. When the frame is complete, it checks that the length field is 28 and that the sum of the first 30 bytes equals the checksum in the last two bytes; if both are correct, it copies the values into the struct. Because the function takes a parameter of type Stream, the same code works unchanged with SoftwareSerial, the Arduino Mega's Serial1 or the ESP32's HardwareSerial. Since loop() never waits, you can add other tasks too; if you need timing, using millis() instead of delay() is best.
Sleep mode: the SET pin and UART commands
When the PMS5003's laser and fan run continuously, its mean lifetime is about 3 years, and during that time the sensor draws close to 100 mA constantly. Yet air quality changes slowly over minutes, so measuring once every few minutes is enough. You can put the sensor to sleep in two ways: pull the SET pin LOW or send the 7-byte sleep command over UART. While asleep, the fan and laser stop and the current drops below 200 µA. After waking it, you should wait at least 30 seconds for the fan speed to settle before taking readings. For example, if you run every 5 minutes with 30 seconds of warm-up and 20 seconds of measuring, the sensor is active only about one sixth of the time; both energy use and laser wear drop by the same proportion.
| Action | Command bytes (hex) |
|---|---|
| Sleep | 42 4D E4 00 00 01 73 |
| Wake up | 42 4D E4 00 01 01 74 |
| Passive mode (send only on request) | 42 4D E1 00 00 01 70 |
| Active mode (send continuously, default) | 42 4D E1 00 01 01 71 |
| Request a single reading in passive mode | 42 4D E2 00 00 01 71 |
LED air quality indicator with the ESP32
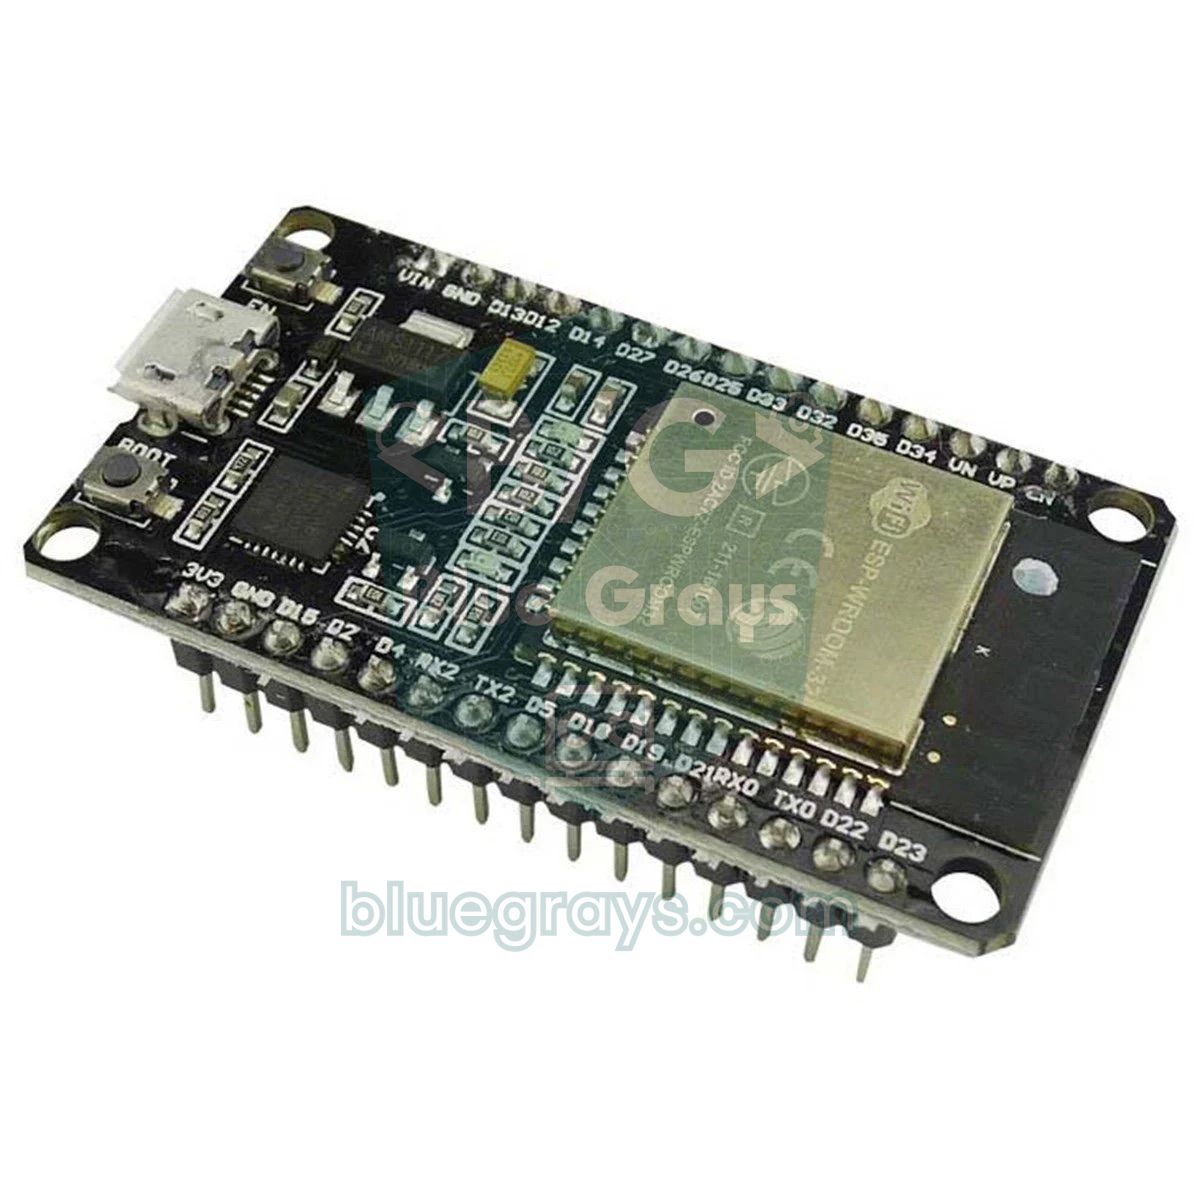
The ESP32 has three hardware UARTs and you can route their pins to any GPIO you like, so you don't need SoftwareSerial. Since the ESP32 runs at 3.3 V, you can connect the sensor's RX and TX lines directly; only VCC still has to come from the 5V (VIN) pin. The code below wakes the sensor with the SET pin, waits 30 seconds, averages PM2.5 and PM10 over 8 frames and puts the sensor back to sleep. Depending on the result, one of the green, yellow and red LEDs connected to GPIO 25, 26 and 27 lights up. Don't forget a 220 Ω series resistor for each LED; you can check the value with the LED resistor calculator.
1#include <Arduino.h>
2
3#define PMS_RX     16   // ESP32 RX2 <- sensör TX / ESP32 RX2 <- sensor TX
4#define PMS_TX     17   // ESP32 TX2 -> sensör RX / ESP32 TX2 -> sensor RX
5#define PMS_SET    4    // HIGH = çalış, LOW = uyku / HIGH = run, LOW = sleep
6#define LED_GREEN  25
7#define LED_YELLOW 26
8#define LED_RED    27
9
10HardwareSerial pmsSerial(2);   // UART2
11
12uint8_t buf[32];
13uint8_t idx = 0;
14
15uint16_t word16(uint8_t i) {
16  return ((uint16_t)buf[i] << 8) | buf[i + 1];   // yüksek bayt önce / high byte first
17}
18
19// Geçerli çerçeve gelirse atmosferik PM2.5 ve PM10 döndürür
20// Returns atmospheric PM2.5 and PM10 when a valid frame arrives
21bool readPms(uint16_t &pm25, uint16_t &pm10) {
22  while (pmsSerial.available()) {
23    uint8_t c = pmsSerial.read();
24    if (idx == 0 && c != 0x42) continue;
25    if (idx == 1 && c != 0x4D) { idx = (c == 0x42) ? 1 : 0; continue; }
26    buf[idx++] = c;
27    if (idx < 32) continue;
28    idx = 0;
29    if (word16(2) != 28) return false;            // uzunluk / length
30    uint16_t sum = 0;
31    for (uint8_t i = 0; i < 30; i++) sum += buf[i];
32    if (sum != word16(30)) return false;          // sağlama toplamı / checksum
33    pm25 = word16(12);
34    pm10 = word16(14);
35    return true;
36  }
37  return false;
38}
39
40void showLevel(float pm25) {
41  digitalWrite(LED_GREEN,  pm25 <= 15.0);                   // DSÖ 24 saat sınırı / WHO 24 h guideline
42  digitalWrite(LED_YELLOW, pm25 > 15.0 && pm25 <= 35.4);
43  digitalWrite(LED_RED,    pm25 > 35.4);                    // EPA hassas grup sınırı / EPA sensitive group limit
44}
45
46void setup() {
47  Serial.begin(115200);
48  pinMode(PMS_SET, OUTPUT);
49  pinMode(LED_GREEN, OUTPUT);
50  pinMode(LED_YELLOW, OUTPUT);
51  pinMode(LED_RED, OUTPUT);
52  pmsSerial.begin(9600, SERIAL_8N1, PMS_RX, PMS_TX);
53}
54
55void loop() {
56  digitalWrite(PMS_SET, HIGH);                    // sensörü uyandır / wake the sensor
57  Serial.println("Isinma 30 sn / Warm-up 30 s");
58  delay(30000);                                   // fan kararlı hale gelsin / let the fan stabilise
59
60  while (pmsSerial.available()) pmsSerial.read(); // eski verileri at / drop stale data
61  idx = 0;
62
63  uint32_t sum25 = 0, sum10 = 0;
64  uint8_t count = 0;
65  unsigned long start = millis();
66  while (count < 8 && millis() - start < 25000) {
67    uint16_t pm25, pm10;
68    if (readPms(pm25, pm10)) {
69      sum25 += pm25;
70      sum10 += pm10;
71      count++;
72    }
73    delay(10);
74  }
75
76  digitalWrite(PMS_SET, LOW);                     // uyku: fan ve lazer durur / sleep: fan and laser stop
77
78  if (count > 0) {
79    float avg25 = (float)sum25 / count;
80    float avg10 = (float)sum10 / count;
81    Serial.printf("PM2.5: %.1f  PM10: %.1f ug/m3 (%u olcum / samples)\n", avg25, avg10, (unsigned)count);
82    showLevel(avg25);
83  } else {
84    Serial.println("Veri yok, kabloyu kontrol et / No data, check wiring");
85  }
86
87  delay(4UL * 60UL * 1000UL);                     // yaklaşık 5 dakikada bir ölç / measure about every 5 minutes
88}
Instead of a single reading, the code averages 8 frames; since the sensor sends a frame about every 2.3 seconds in stable mode, a 25-second window is enough for that. The buffer is flushed after waking because old readings accumulated during warm-up would skew the average. The WHO 24-hour recommendation of 15 µg/m³ is used as the green threshold and the EPA limit of 35.4 µg/m³ as the red threshold; you can change them to suit your needs. The sensor runs for at most 55 seconds of the roughly 5-minute cycle. For a battery-powered station you can also put the ESP32 into deep sleep while waiting; in that case, don't forget to lock the pin state with gpio_hold_en() so the SET pin stays LOW. Showing the result as a number on an OLED display makes the indicator much more informative too.
MicroPython code with the Raspberry Pi Pico
The Raspberry Pi Pico has two hardware UARTs; here we chose UART0, which uses pins GP0 (TX) and GP1 (RX). Because the Pico runs on 3.3 V logic, it talks to the sensor directly. Take the sensor's 5 V supply from the VBUS pin (pin 40); this pin gives 5 V only when the Pico is powered over USB. For battery use, you can generate 5 V with a booster such as the MT3608 and feed it to both the sensor and the Pico's VSYS pin. In this example sleep and wake are done with UART commands instead of the SET pin, so you connect one less wire. If you're new to MicroPython, first take a look at the MicroPython basics post.
1from machine import UART, Pin
2import time
3import struct
4
5uart = UART(0, baudrate=9600, tx=Pin(0), rx=Pin(1))   # GP0 -> sensör RX, GP1 <- sensör TX / GP0 -> sensor RX, GP1 <- sensor TX
6
7SLEEP = bytes([0x42, 0x4D, 0xE4, 0x00, 0x00, 0x01, 0x73])   # uyku / sleep
8WAKE = bytes([0x42, 0x4D, 0xE4, 0x00, 0x01, 0x01, 0x74])    # uyandır / wake up
9
10def read_exact(n, timeout_ms):
11    data = b""
12    t0 = time.ticks_ms()
13    while len(data) < n:
14        if time.ticks_diff(time.ticks_ms(), t0) > timeout_ms:
15            return None                       # zaman aşımı / timeout
16        chunk = uart.read(n - len(data))
17        if chunk:
18            data += chunk
19    return data
20
21def read_pms(timeout_ms=5000):
22    t0 = time.ticks_ms()
23    while time.ticks_diff(time.ticks_ms(), t0) < timeout_ms:
24        if read_exact(1, 500) != b"\x42":     # başlangıç baytı / start byte
25            continue
26        if read_exact(1, 100) != b"\x4d":
27            continue
28        rest = read_exact(30, 500)
29        if rest is None:
30            continue
31        frame = b"\x42\x4d" + rest
32        if (frame[2] << 8 | frame[3]) != 28:  # uzunluk / length
33            continue
34        if sum(frame[:30]) != (frame[30] << 8 | frame[31]):   # sağlama toplamı / checksum
35            continue
36        return struct.unpack(">HHH", frame[10:16])   # PM1.0, PM2.5, PM10 (atmosferik / atmospheric)
37    return None
38
39def level(pm25):
40    if pm25 <= 15:
41        return "IYI / GOOD"
42    if pm25 <= 35.4:
43        return "ORTA / MODERATE"
44    return "KOTU / POOR"
45
46while True:
47    uart.write(WAKE)
48    time.sleep(30)                            # fan ısınması / fan warm-up
49    while uart.any():
50        uart.read()                           # eski verileri at / drop stale data
51    values = []
52    for _ in range(8):
53        r = read_pms()
54        if r:
55            values.append(r[1])
56    uart.write(SLEEP)
57    if values:
58        avg = sum(values) / len(values)
59        print("PM2.5: {:.1f} ug/m3 -> {}".format(avg, level(avg)))
60    else:
61        print("Veri yok / No data")
62    time.sleep(270)                           # yaklaşık 5 dakikalık döngü / about 5 minute cycle
The read_exact() helper waits with a timeout until the requested number of bytes arrives, so the program doesn't hang forever if the wire comes out. In struct.unpack(">HHH", ...), the ">" sign means the data is big-endian and each "H" stands for a 16-bit unsigned number; bytes 10–15 are the atmospheric PM1.0, PM2.5 and PM10 values. The last two bytes of the commands are also a checksum: for the wake command, 0x42 + 0x4D + 0xE4 + 0x00 + 0x01 = 0x0174, so the command ends with 01 74. The sensor answers some commands with a short response frame; the length check filters these out automatically. If you use a Pico W, you can also send the readings to a server over MQTT.
PMS5003 project ideas
- Home air quality station: show PM2.5 in large digits on an OLED display, with temperature, humidity and pressure from a BME280 next to it.
- Stove and fireplace alarm: sound a buzzer when PM2.5 rises quickly in a short time; for carbon monoxide, always use a separate MQ-7 or a certified detector.
- Colour AQI lamp: instead of three LEDs, light a WS2812B ring in the EPA colours.
- Smart air purifier: adjust a fan's speed with PWM according to the measurement; details are in the fan control post.
- Home Assistant integration: send the values with an ESP32 over MQTT and watch the graphs from your phone.
- Pollution logger: write the values to Google Sheets or an SD card to plot the daily pollution curve all winter.
- Complete indoor package: measure particles with the PMS5003, carbon dioxide with the MH-Z19 and volatile organic compounds with the CCS811.
Common mistakes and how to fix them
| Symptom | Likely cause | Fix |
|---|---|---|
| No data at all | TX and RX not crossed | Connect the sensor's TX to the board's RX and the sensor's RX to the board's TX |
| Fan doesn't spin, no data | VCC powered from 3.3 V or SET pin is LOW | Connect VCC to 5 V, set SET HIGH or leave it open |
| Meaningless, jumping numbers | Baud rate isn't 9600 or checksum isn't verified | Use 9600 8N1, verify the length and checksum |
| Values always between 0 and a few | The air really is clean or the inlet is blocked | Test the sensor near a dust source, keep the openings clear |
| Very high values in foggy and rainy weather | Humidity above 80%, water droplets counted as particles | Measure humidity too and flag readings as doubtful at high humidity |
| First readings after waking are inconsistent | The fan hasn't reached a stable speed yet | Wait at least 30 seconds after waking |
| ESP32 restarts randomly | Fan and Wi-Fi current strain a weak USB supply | Use a good cable and a strong adapter, power the sensor from a separate 5 V source if needed |
With the PMS5003, a few wires and a correctly decoded 32-byte frame, you can monitor the air in your home and street cheaply and quite consistently; seeing with your own eyes how the values climb during winter stove hours also builds good awareness. For gas measurement, you can combine it with the MQ-135 to build a complete air quality station. In the BlueGrays app you'll find projects such as an ESP32 gas alarm, a DHT22 LCD measurement station and an OLED weather and temperature logger step by step with circuit diagrams and code, and you can easily add the PMS5003 to them.
Frequently asked questions
What's the difference between the PMS5003 and PMS7003?
Both are Plantower laser dust sensors and use the same 32-byte data frame and the same commands, so the code in this post works on both. The PMS7003 has a slimmer body and a different connector, while the PMS5003 is more common and usually cheaper. Their measurement accuracy is very close in practice.
How do you connect a dust sensor to an Arduino Uno?
Connect the PMS5003's VCC to 5V, GND to GND and TX to D2, and read it with SoftwareSerial at 9600 baud. If you'll send commands to the sensor, bring the Uno's 5 V TX output down to 3.3 V with a voltage divider before feeding the sensor's RX pin. If you'll only read data, you can leave RX unconnected.
How accurate is the PMS5003?
The manufacturer specifies ±10 µg/m³ accuracy in the 0–100 µg/m³ range and ±10% in the 100–500 µg/m³ range. Its consistency is good among low-cost sensors, but it doesn't replace official reference stations. When relative humidity exceeds 80%, water droplets are counted too, so readings can come out higher than the real values.
What PM2.5 value is dangerous?
The WHO recommends that the 24-hour average of PM2.5 not exceed 15 µg/m³. On the EPA scale, above 35.5 µg/m³ is unhealthy for sensitive groups, above 55.5 µg/m³ is unhealthy for everyone and above 225.5 µg/m³ is considered hazardous. These limits are for averages; during a short burst of smoke, the instant value can be much higher.
Can you leave the PMS5003 on all the time?
You can, but the mean life of the laser and fan is about 3 years and the sensor draws close to 100 mA while running. Because air quality changes slowly, waking it every few minutes and measuring after 30 seconds of warm-up greatly improves lifetime and energy use. To sleep it, just pull the SET pin LOW or send the UART sleep command.
Does a dust sensor detect smoke or carbon monoxide?
The PMS5003 detects the fine particles in cigarette and stove smoke very well as PM1.0 and PM2.5, but it doesn't measure gases. Carbon monoxide is a colourless gas with no particles, so the sensor can't notice it. In rooms with a stove, always keep a separate, certified carbon monoxide detector.
Projects to build after reading this
See all projects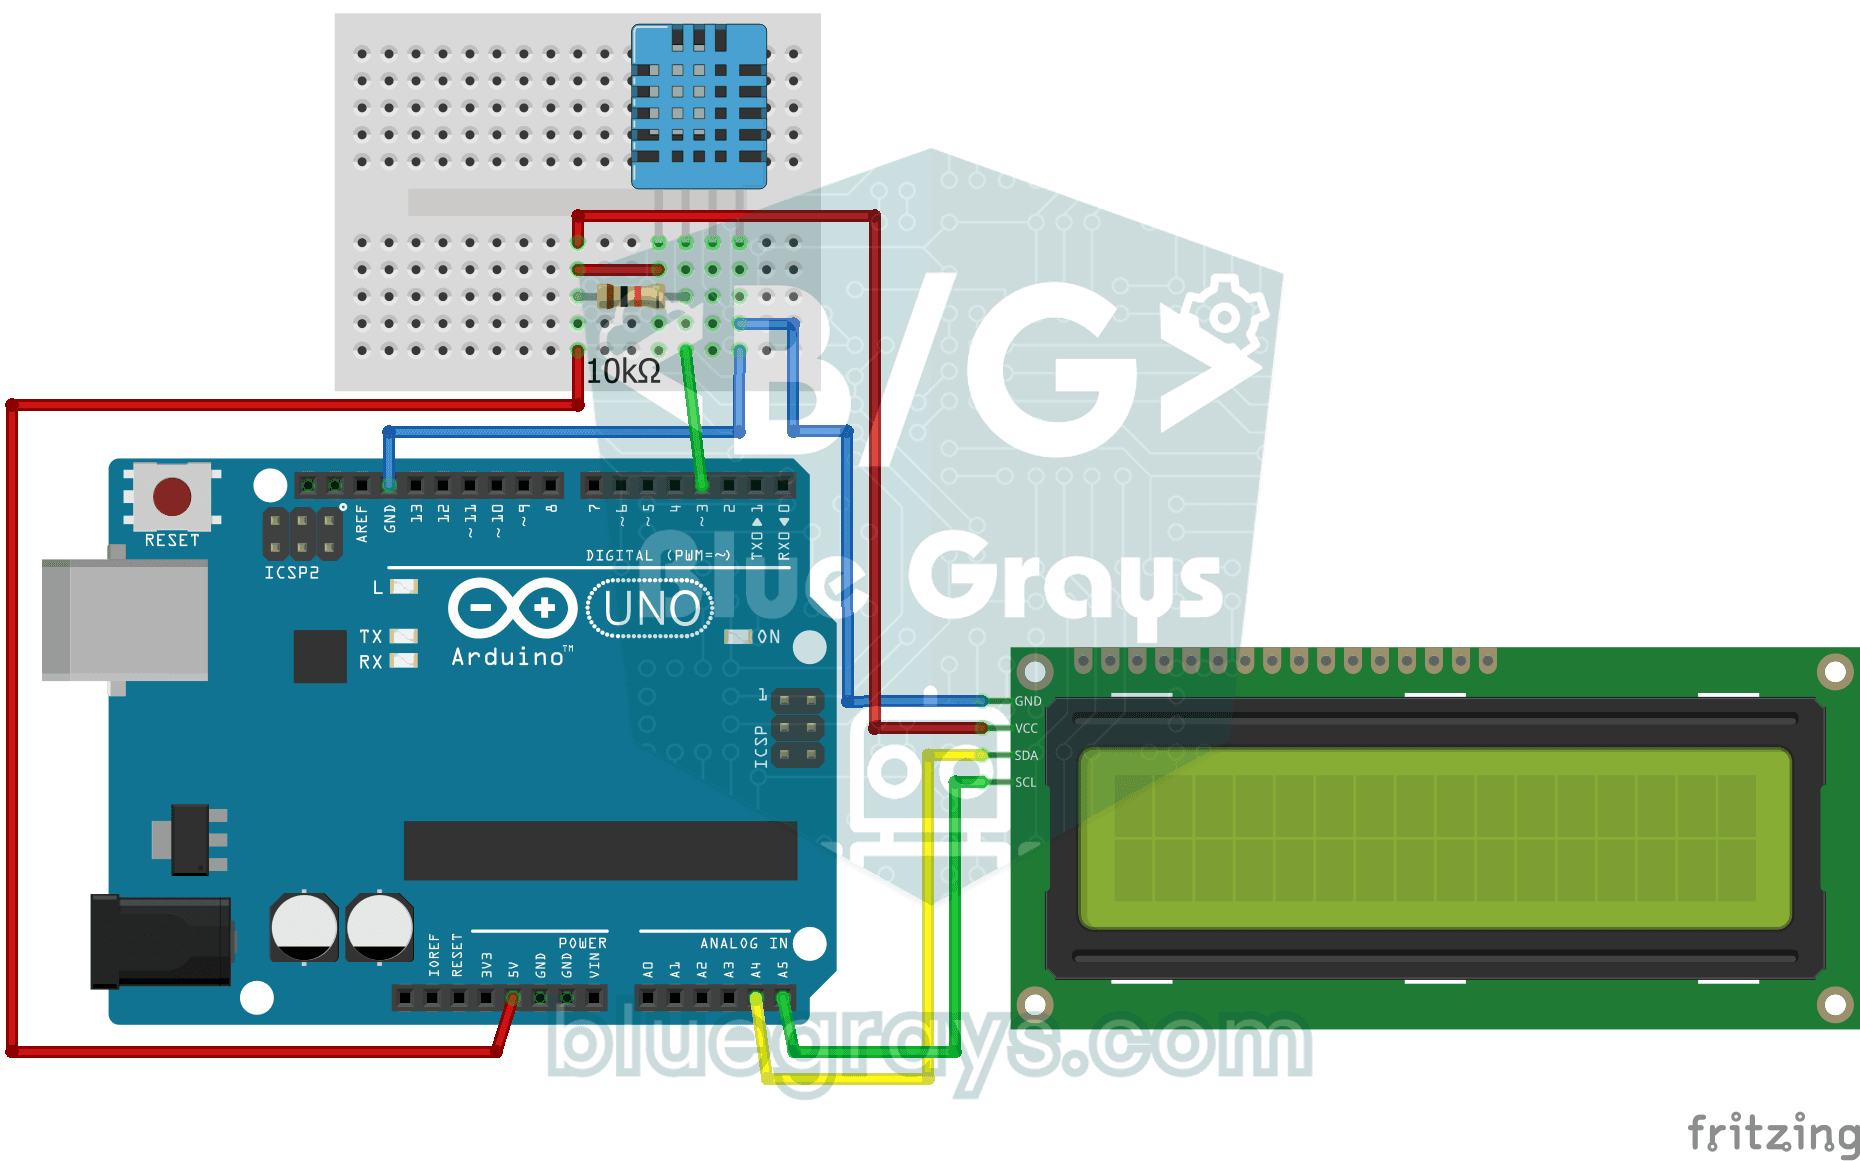
Temperature and Humidity with DHT11
How warm is your room, and is the air humid or dry? The DHT11 sensor measures temperature and humidity, and the Arduino writes the values on a two-line LCD screen, refreshing every couple of seconds.

ESP32 MQ-2 Gas/Smoke Detector Alarm
In this project, combustible gas (LPG, methane, propane) and smoke detection is performed using an MQ-2 gas sensor module, and a siren-like alarm is played through a passive buzzer upon detection. The sensor's digital threshold output (DO) is connected to GPIO 4 on the ESP32; when gas or smoke exceeds the threshold, DO goes LOW and the alarm is triggered. Sensitivity is adjusted via the module's potentiometer. The passive buzzer is driven using tone() to produce a two-frequency siren effect.
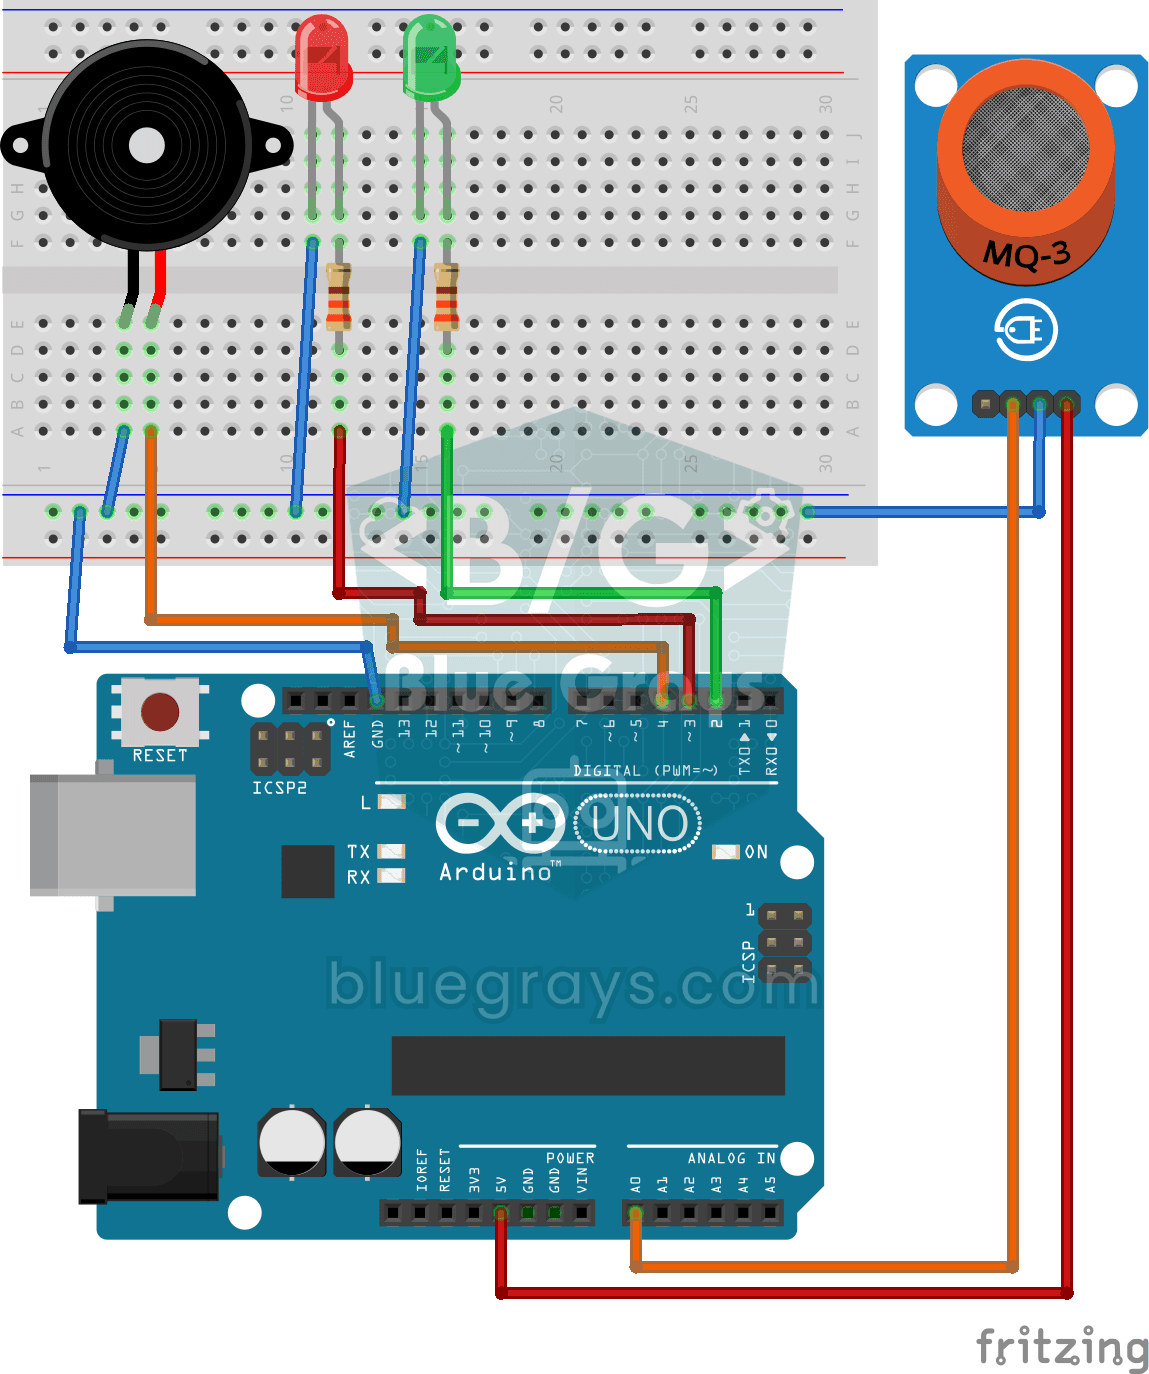
Using a Gas Sensor
A little guard that notices a gas leak in the kitchen before you do. The gas sensor keeps sniffing the air; while everything is fine the green LED stays on, and when the gas in the air passes a…

ESP32 DHT22 Temperature and Humidity (with LCD Display)
This project measures ambient temperature and humidity using a DHT22 sensor and displays the data in real time on a 16x2 I2C LCD. Data is read from the sensor using the one-wire protocol via the Adafruit DHT library. This project serves as the foundation for IoT weather stations, smart home automation, or environmental monitoring systems in greenhouses. Communication with the DHT22 is established via the ESP32's GPIO 4 pin.

ESP32 HTTPClient + Weather API (with SSD1306 OLED Display)
In this project the ESP32 makes a REST API call over the internet to a weather API (wttr.in) using HTTPClient.h. Unlike the I2C LCD version, it uses an SSD1306 OLED (128×64) display, with large text and vector icons for a richer look. Seven weather icons (sunny, rainy, snowy and more) are drawn on the fly, with no bitmap files.
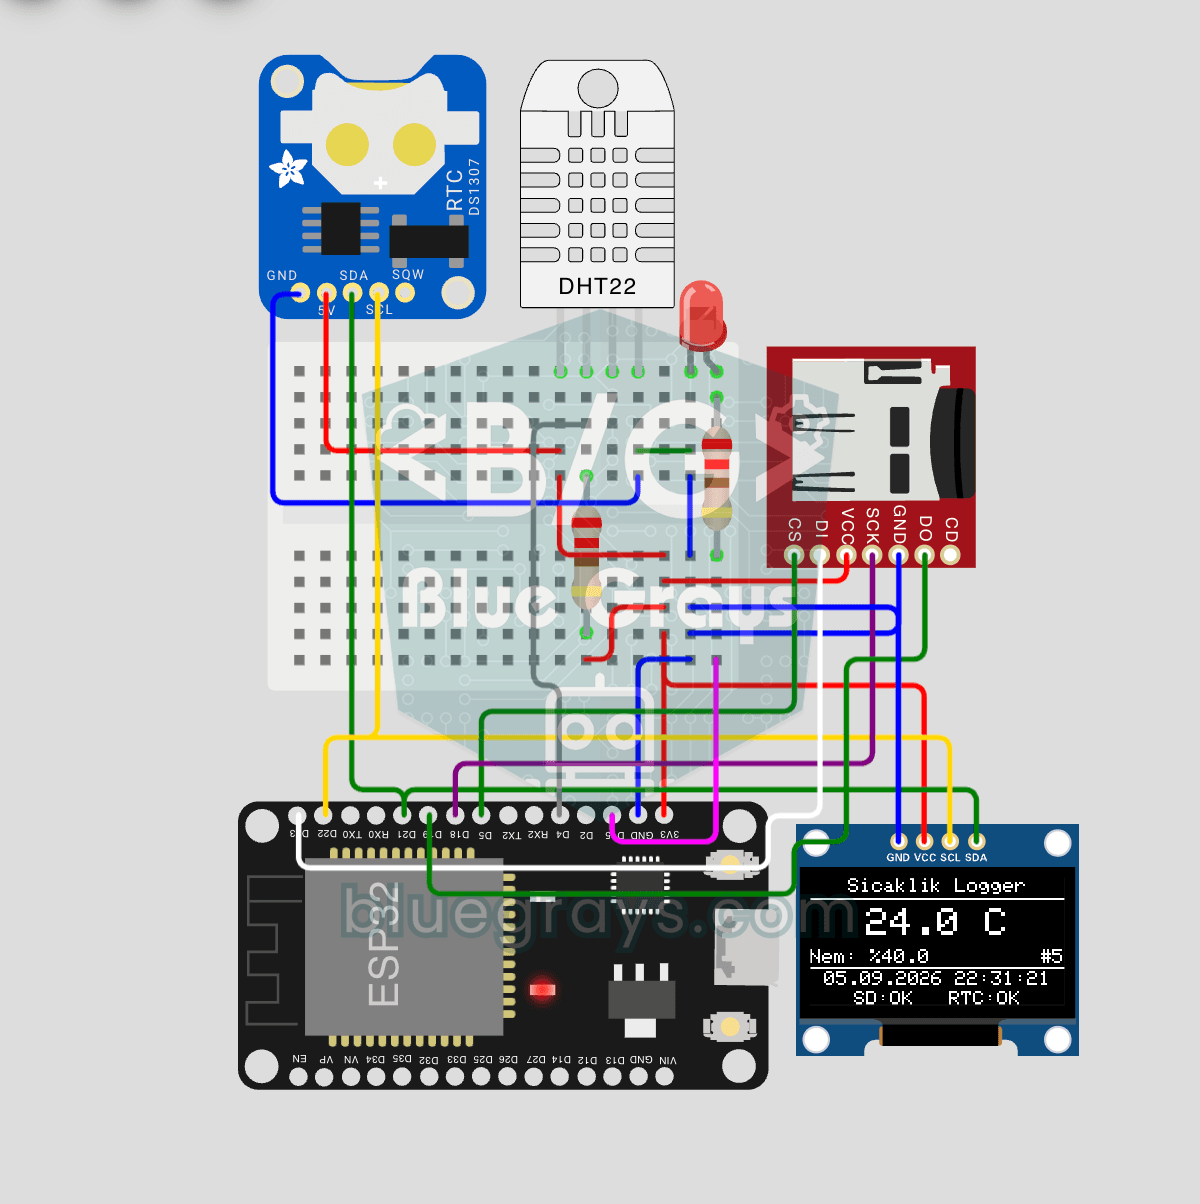
ESP32 Temperature Data Logger (DHT22 + DS1307 RTC + microSD + OLED)
Build a timed temperature and humidity logger with the ESP32! A DHT22 sensor reads temperature and humidity once a minute, and each reading is saved to a microSD card in CSV format with a real-time stamp from the DS1307 RTC module. The OLED display shows the latest temperature, humidity, timestamp and total number of records live, in large text.

ESP32 Deep Sleep — Battery Saving (OLED + RTC RAM Counter)
The ESP32's Deep Sleep mode shuts down the CPU and most peripherals, cutting current draw to about 10µA, which is vital for battery-powered IoT devices. This project uses three wake-up sources: a timer (15 s), an external pin (EXT0, the button on GPIO 33) and a touch pin (T0/GPIO 4). Counters marked with RTC_DATA_ATTR survive deep sleep.

Dot Matrix Clock, Calendar and Weather Station (MAX7219, DS1307)
A scrolling-text board for your desk or wall that shows the time, the date and the room's weather in turn.